Fig. 5.
Download original image
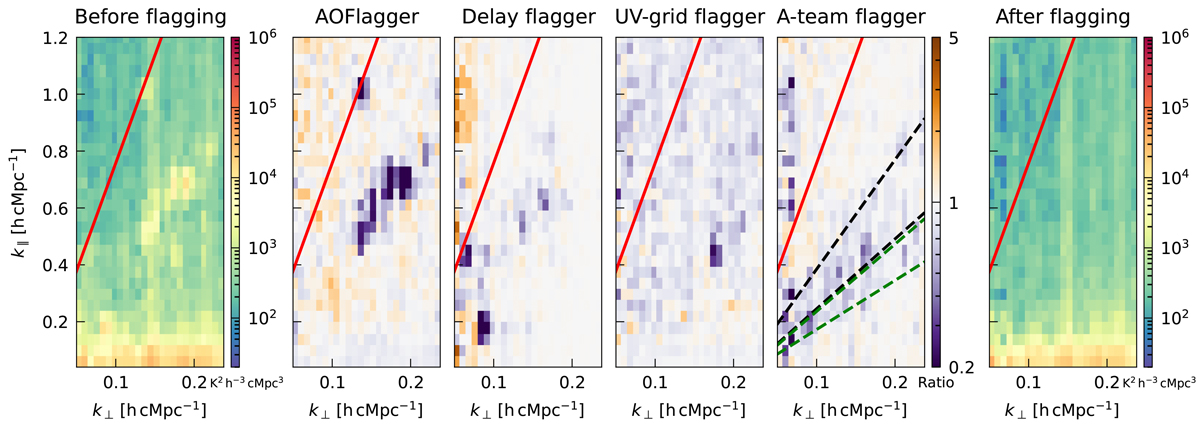
Effect of post-calibration flagging steps on the 2D power spectra for observation L246309 in the frequency range 134–147 MHz. The left panel shows the power spectra before any calibration. The four middle panels display the ratio of power spectra before and after each successive flagging step, illustrating the progressive reduction of contamination. The four steps, shown in order, are: (1) post-calibration wide-bandwidth AOFlagger; (2) baseline flagging of delay-spectrum outliers above the horizon limit; (3) post-gridding flagging based on outlier detection in channels and uv-cells; and (4) post-gridding flagging of uv-cells contaminated by A-team sidelobes. The right panel shows the power spectra after all steps have been applied. While some steps increase thermal noise (e.g. step 2, which removes entire baselines), they are effective in reducing RFI-related contamination. In all panels, the foreground horizon line is shown as a solid red line, while the dashed green and black lines indicate the delay ranges where most of the power from Cas A and Cygnus A is expected, respectively.
Current usage metrics show cumulative count of Article Views (full-text article views including HTML views, PDF and ePub downloads, according to the available data) and Abstracts Views on Vision4Press platform.
Data correspond to usage on the plateform after 2015. The current usage metrics is available 48-96 hours after online publication and is updated daily on week days.
Initial download of the metrics may take a while.