Fig. 3.
Download original image
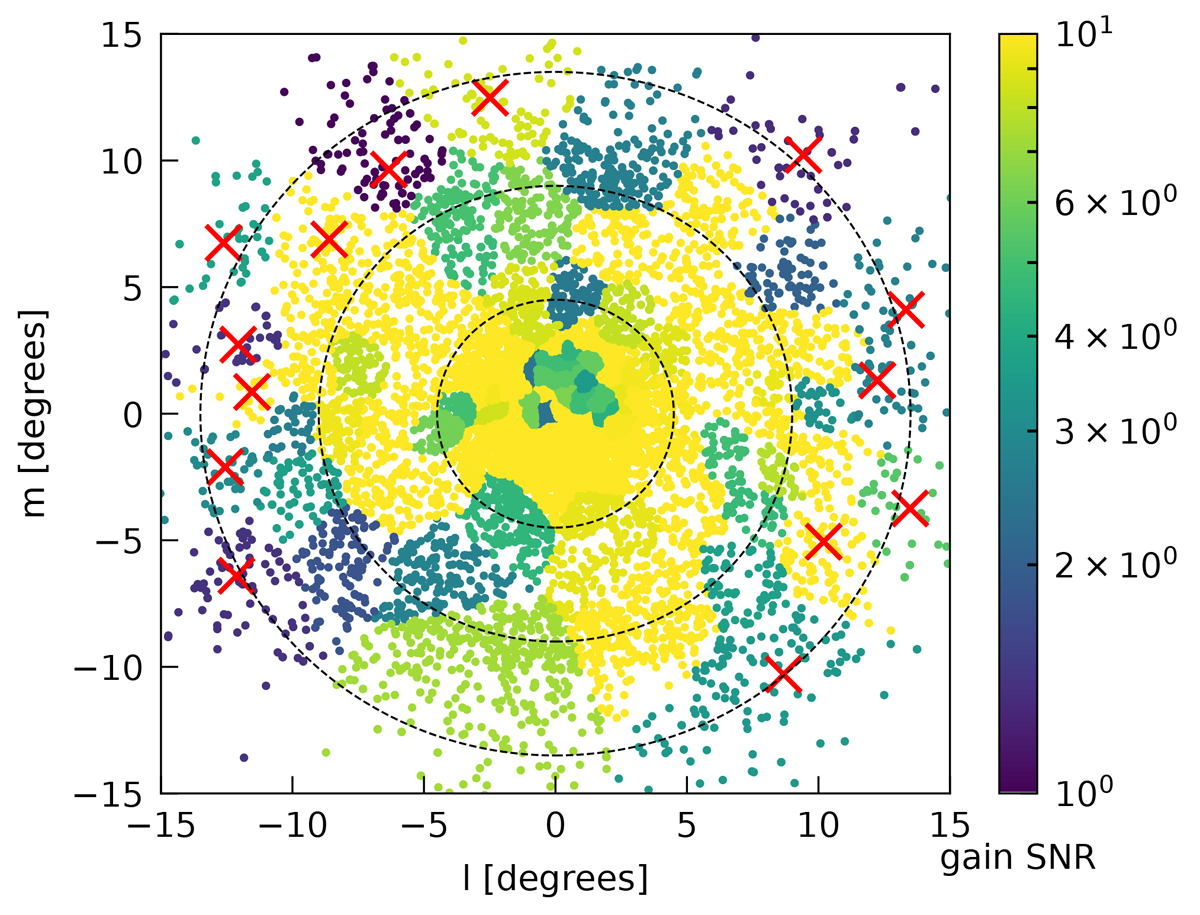
Signal-to-noise ratio (S/N) of the time-differenced solutions for all ∼28 000 sky components of LOFAR20 in real data. Clusters of components can be recognised since they share the same gain solutions. In total, there are 120 clusters in the image. The S/N is similar for most clusters, but showing a slight gradient to lower S/N values away from the phase centre. The components in the outer 14 clusters (with a flux weighted mean position more than 10 degrees away from the phase centre), indicated with red crosses, have been removed from the model used in the current analysis.
Current usage metrics show cumulative count of Article Views (full-text article views including HTML views, PDF and ePub downloads, according to the available data) and Abstracts Views on Vision4Press platform.
Data correspond to usage on the plateform after 2015. The current usage metrics is available 48-96 hours after online publication and is updated daily on week days.
Initial download of the metrics may take a while.