Fig. 16.
Download original image
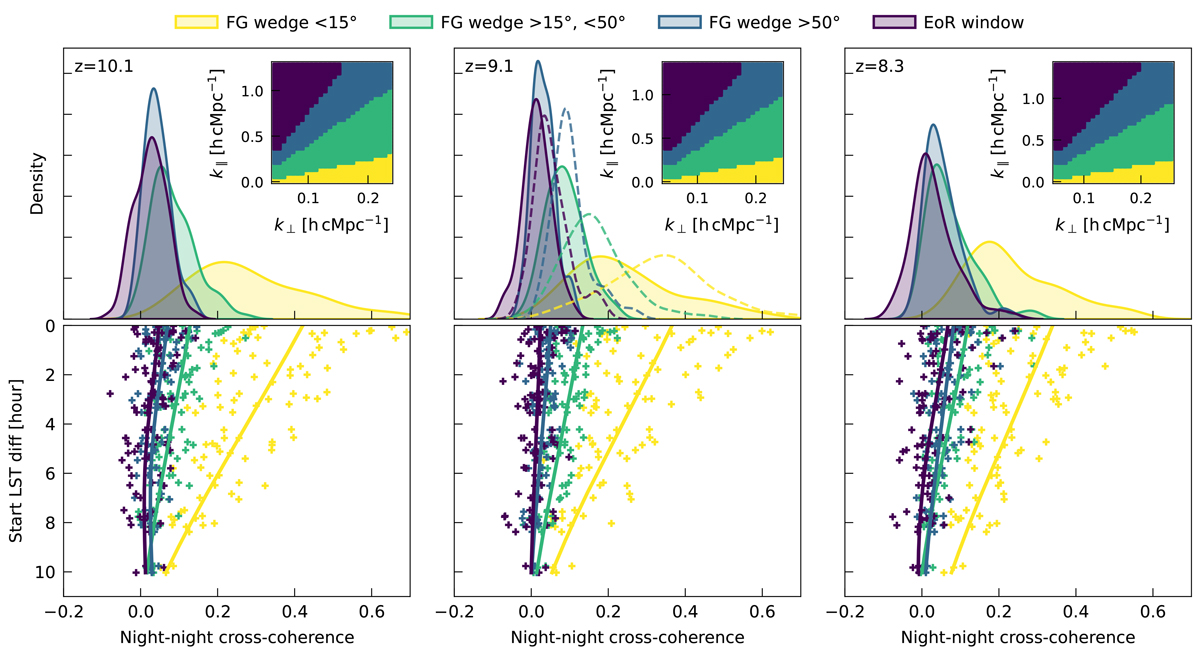
Night-to-night cross-coherence for different regions of the cylindrically averaged power spectra, evaluated over all pairs of nights and across the three redshift bins. The top panels display density plots of the cross-coherence values, with colours indicating different regions of the power spectra (the specific regions are illustrated in the insets). The bottom panels present the individual cross-coherence values as a function of Local Sidereal Times (LST) time difference, along with a fitted trend line to highlight the overall pattern. For the redshift bin at z≈9.1 (middle panel), we also include in a dashed line the cross-coherence results from LOFAR20 for comparison.
Current usage metrics show cumulative count of Article Views (full-text article views including HTML views, PDF and ePub downloads, according to the available data) and Abstracts Views on Vision4Press platform.
Data correspond to usage on the plateform after 2015. The current usage metrics is available 48-96 hours after online publication and is updated daily on week days.
Initial download of the metrics may take a while.