Fig. 14.
Download original image
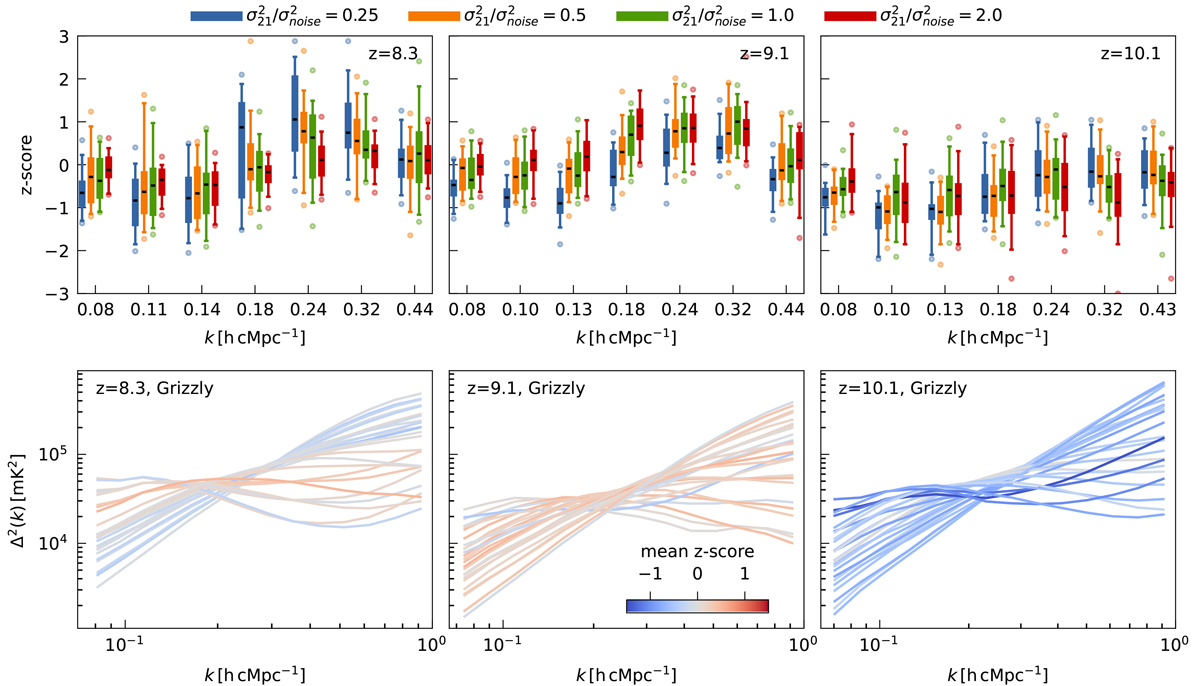
Results of the injection test, validating the ML-GPR residual foreground removal step, with the Grizzly simulations. The top plots show the z-score as a function of k-mode. A total of 25 synthetic 21 cm signals are tested, each with four different intensities. Each box-plot represents the distribution of z-scores for all 25 cases, with different box-plot colours indicating different signal intensities. The central line represents the median z-score, the box edges indicate the 25th and 75th percentiles (interquartile range), the whiskers extend to the data points within 1.5 times the interquartile range, and individual points beyond the whiskers represent outliers. A negative z-score suggests absorption of the signal, with values below −2 indicating absorption beyond the 2-σ upper limits. The bottom panel shows the spherically averaged power spectrum (for ![]() ) of the injected signal, with colours indicating the mean z-score.
) of the injected signal, with colours indicating the mean z-score.
Current usage metrics show cumulative count of Article Views (full-text article views including HTML views, PDF and ePub downloads, according to the available data) and Abstracts Views on Vision4Press platform.
Data correspond to usage on the plateform after 2015. The current usage metrics is available 48-96 hours after online publication and is updated daily on week days.
Initial download of the metrics may take a while.