Fig. 12.
Download original image
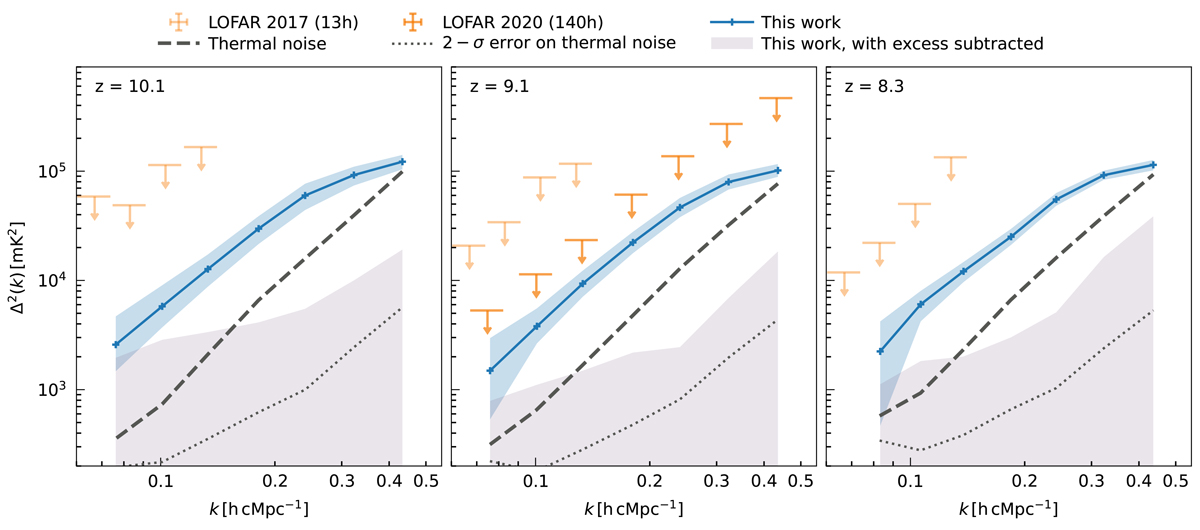
Final spherically averaged power spectra from the combined 10-night dataset, after ML-GPR residual foreground removal and noise bias removal, are shown as the blue line, with the shaded blue area representing the 95% confidence interval. Previous LOFAR upper limits from LOFAR20 (dark orange line) and Patil et al. (2017) (light orange line) are included for comparison. The theoretical thermal noise power spectrum is depicted by the dashed black line, and its 2-σ error is indicated by the dotted line. The new upper limits at z≈9.1 represent an improvement by a factor of 2–4 compared to the LOFAR 2020 results, achieved with comparable observational data. The shaded lavender-grey area represents the 2-σ upper limits that would be obtained if both the ‘excess’ and ‘foreground’ components were subtracted from the data.
Current usage metrics show cumulative count of Article Views (full-text article views including HTML views, PDF and ePub downloads, according to the available data) and Abstracts Views on Vision4Press platform.
Data correspond to usage on the plateform after 2015. The current usage metrics is available 48-96 hours after online publication and is updated daily on week days.
Initial download of the metrics may take a while.