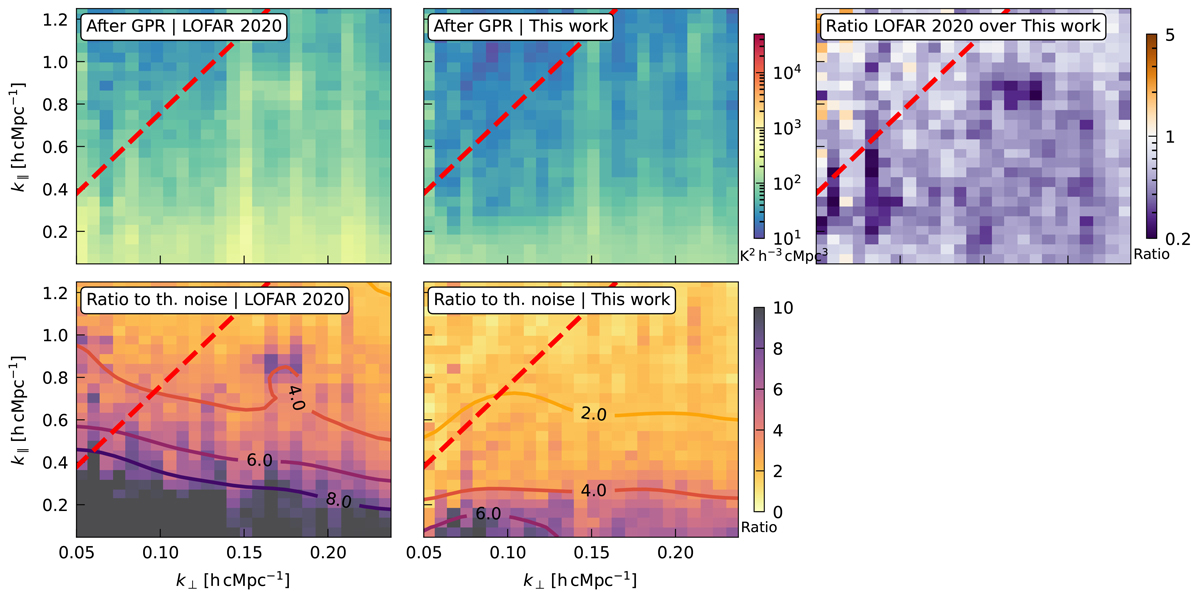
Fig. 11.
Download original image
Comparison between the current results and those of LOFAR20 at redshift z≈9.1. The top row shows the residual cylindrically averaged power spectra after GPR for the LOFAR20 dataset (left panel), the current dataset (middle panel), and the ratio between the two (right panel). The bottom row presents the ratio of the residual power to the thermal noise for the LOFAR20 dataset (left panel) and the current dataset (middle panel), accompanied by smoothed contour maps to emphasise the differences. In all panels, the foreground horizon line is indicated by a dashed red line. The significant reduction in residual power across the full k-space demonstrates the effectiveness of our improved data processing techniques.
Current usage metrics show cumulative count of Article Views (full-text article views including HTML views, PDF and ePub downloads, according to the available data) and Abstracts Views on Vision4Press platform.
Data correspond to usage on the plateform after 2015. The current usage metrics is available 48-96 hours after online publication and is updated daily on week days.
Initial download of the metrics may take a while.