Fig. 10.
Download original image
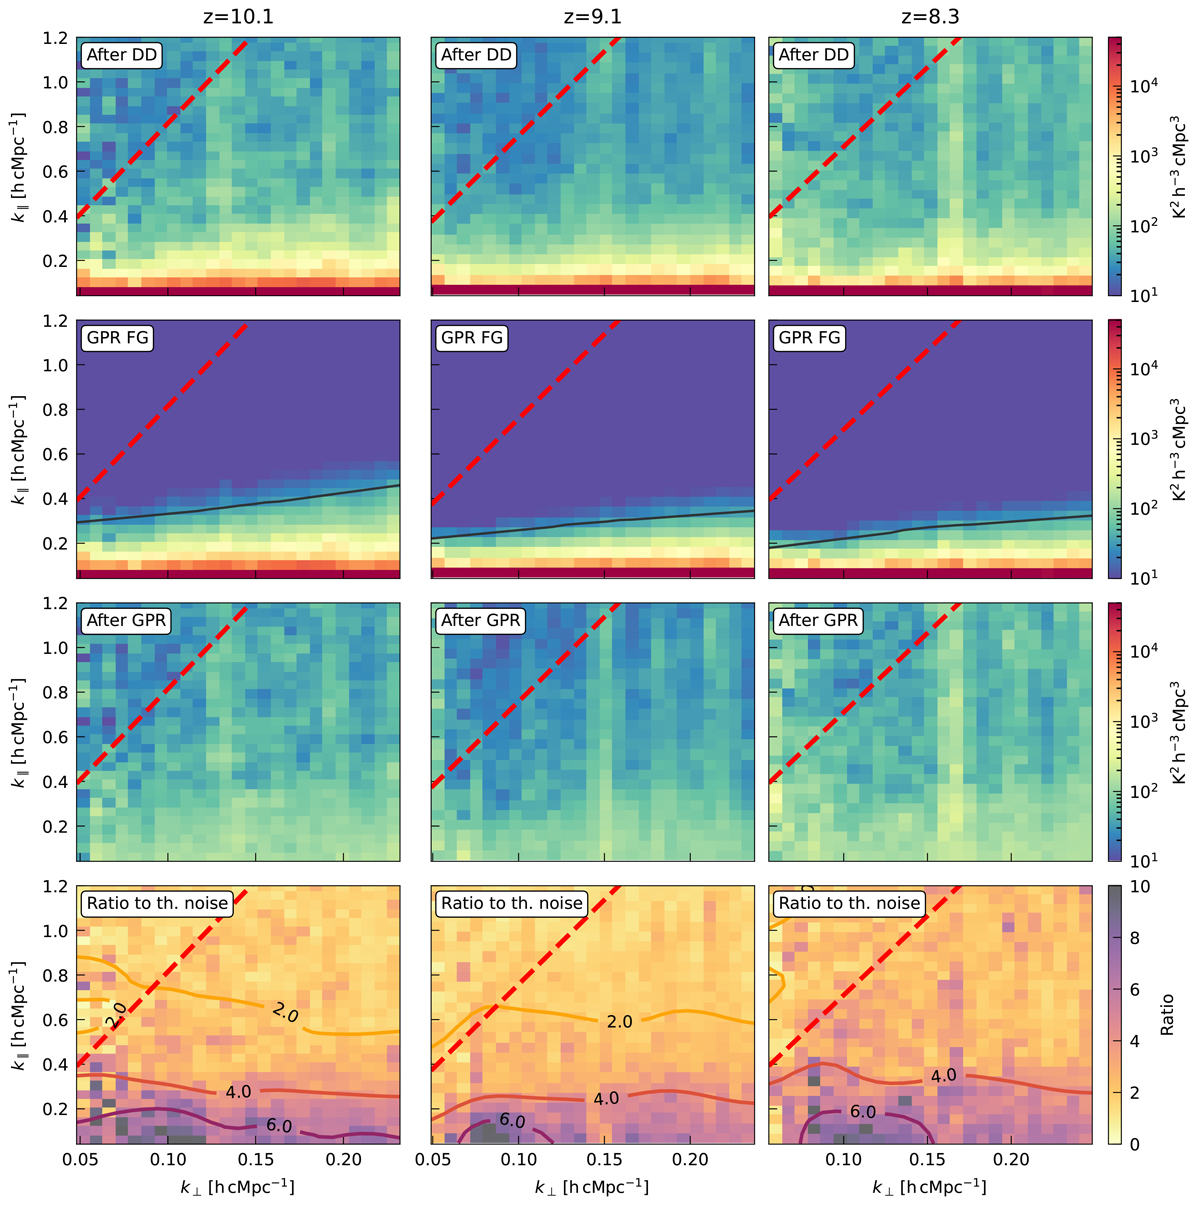
Cylindrically averaged power spectra of the ML-GPR component decomposition of the residual Stokes-I data for the three redshift bins. The top row shows the power spectra before ML-GPR. The second row shows the power spectra of the foreground components only (comprising the ‘sky’ and ‘mode-mixing’ components). The third row presents the power spectra of the residual data after subtracting the foregrounds using ML-GPR. The last row shows the ratio of the residual power to the thermal noise power. In all panels, the foreground horizon line is depicted by a dashed red line. The solid black line in the second row delimits the regions below which the foregrounds power is higher than the thermal noise power.
Current usage metrics show cumulative count of Article Views (full-text article views including HTML views, PDF and ePub downloads, according to the available data) and Abstracts Views on Vision4Press platform.
Data correspond to usage on the plateform after 2015. The current usage metrics is available 48-96 hours after online publication and is updated daily on week days.
Initial download of the metrics may take a while.