Open Access
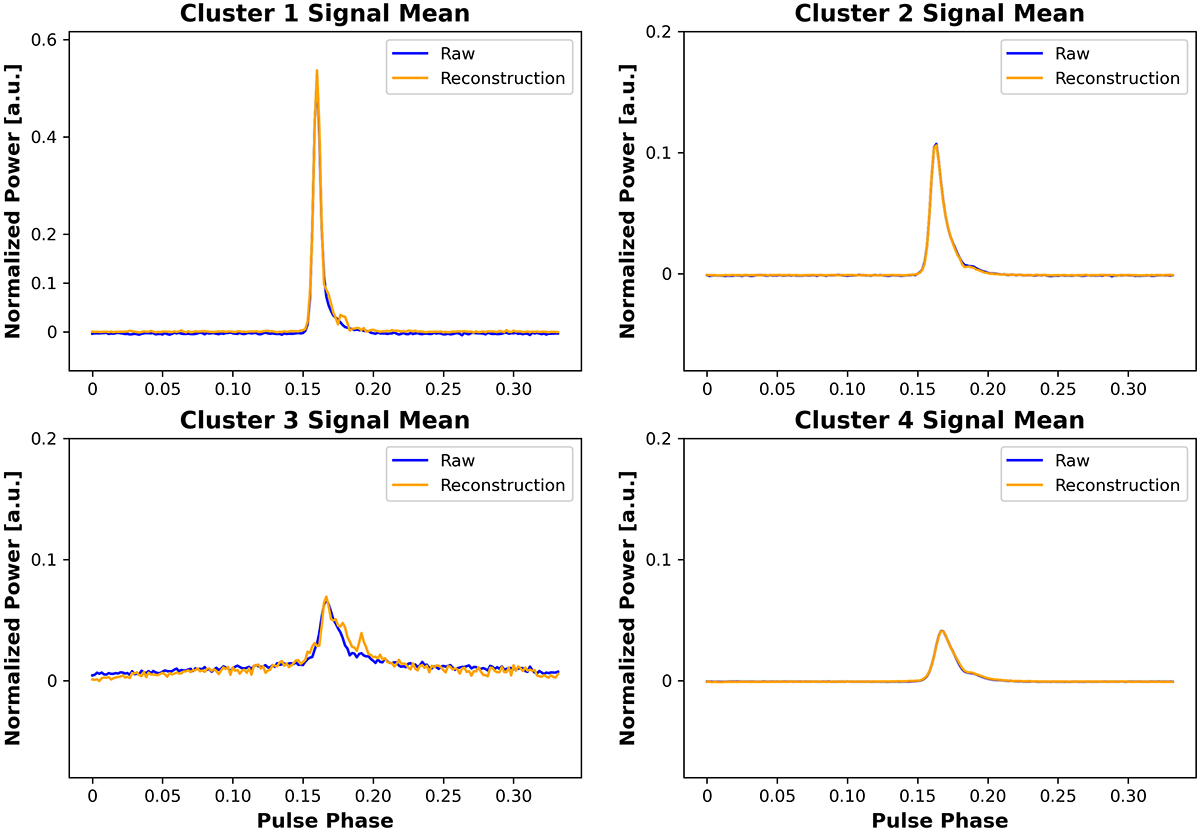
Fig. B.2.
Download original image
Mean reconstructions of individual signals for each of the four SOM clusters from the April 28, 2024 observations with A2. All signals are reconstructed individually using the VAE, then averaged and compared to the mean of the corresponding raw observations.
Current usage metrics show cumulative count of Article Views (full-text article views including HTML views, PDF and ePub downloads, according to the available data) and Abstracts Views on Vision4Press platform.
Data correspond to usage on the plateform after 2015. The current usage metrics is available 48-96 hours after online publication and is updated daily on week days.
Initial download of the metrics may take a while.