Open Access
Fig. 5.
Download original image
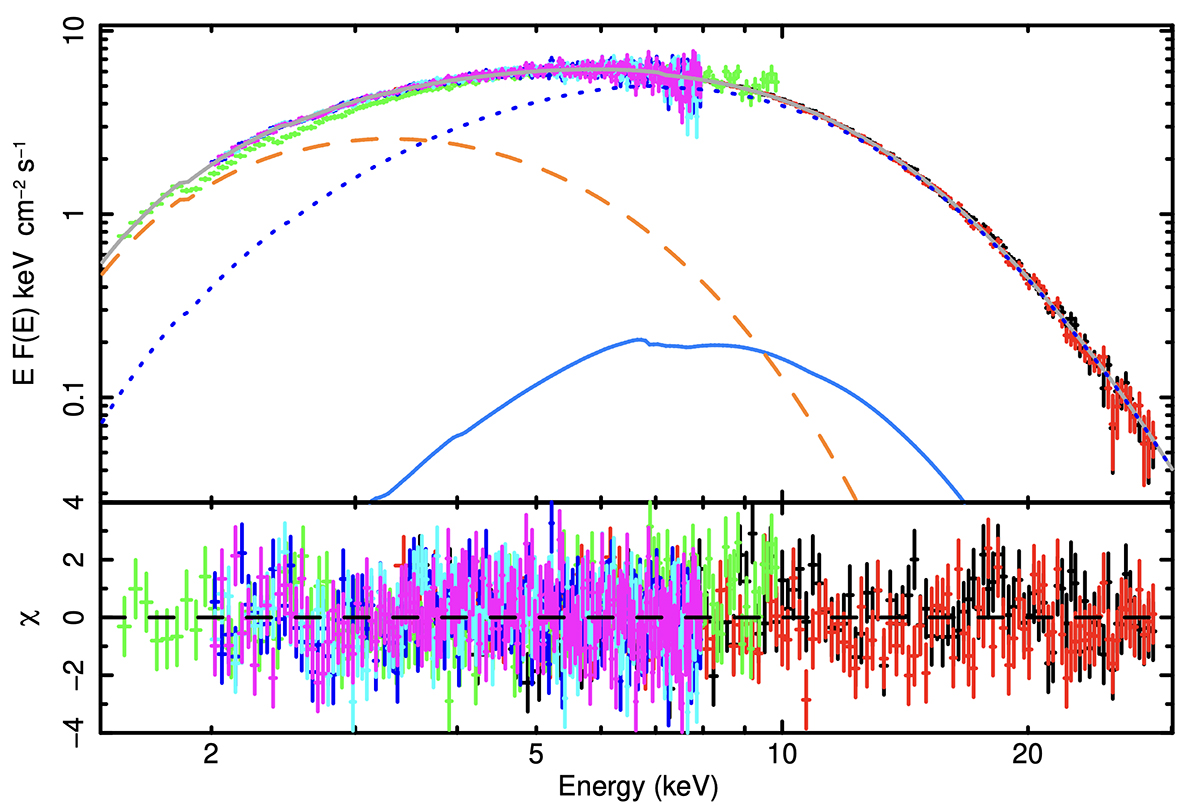
Unfolded spectrum of GX 9+1 as observed by NuSTAR (red and black points), NICER (light green points), and IXPE-I (light blue, magenta and violet points for each DU, respectively). The dotted line indicates the Comptonization component, dashed line shows the disk component, and the solid line represents the reflection.
Current usage metrics show cumulative count of Article Views (full-text article views including HTML views, PDF and ePub downloads, according to the available data) and Abstracts Views on Vision4Press platform.
Data correspond to usage on the plateform after 2015. The current usage metrics is available 48-96 hours after online publication and is updated daily on week days.
Initial download of the metrics may take a while.