Open Access
Fig. 1.
Download original image
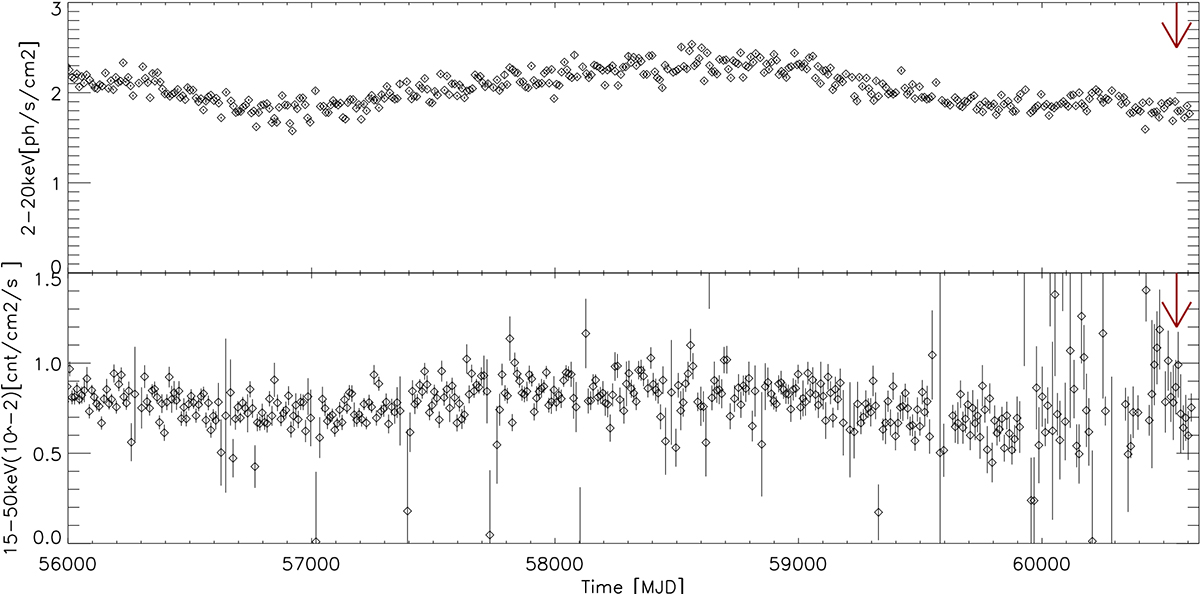
Long-term light curves of GX 9+1 in different energy ranges: 2–20 keV with MAXI (top) and 15–50 keV with BAT (bottom). The arrow indicates the time of the simultaneous IXPE, NuSTAR, NICER, and INTEGRAL observation campaign.
Current usage metrics show cumulative count of Article Views (full-text article views including HTML views, PDF and ePub downloads, according to the available data) and Abstracts Views on Vision4Press platform.
Data correspond to usage on the plateform after 2015. The current usage metrics is available 48-96 hours after online publication and is updated daily on week days.
Initial download of the metrics may take a while.