Fig. 6
Download original image
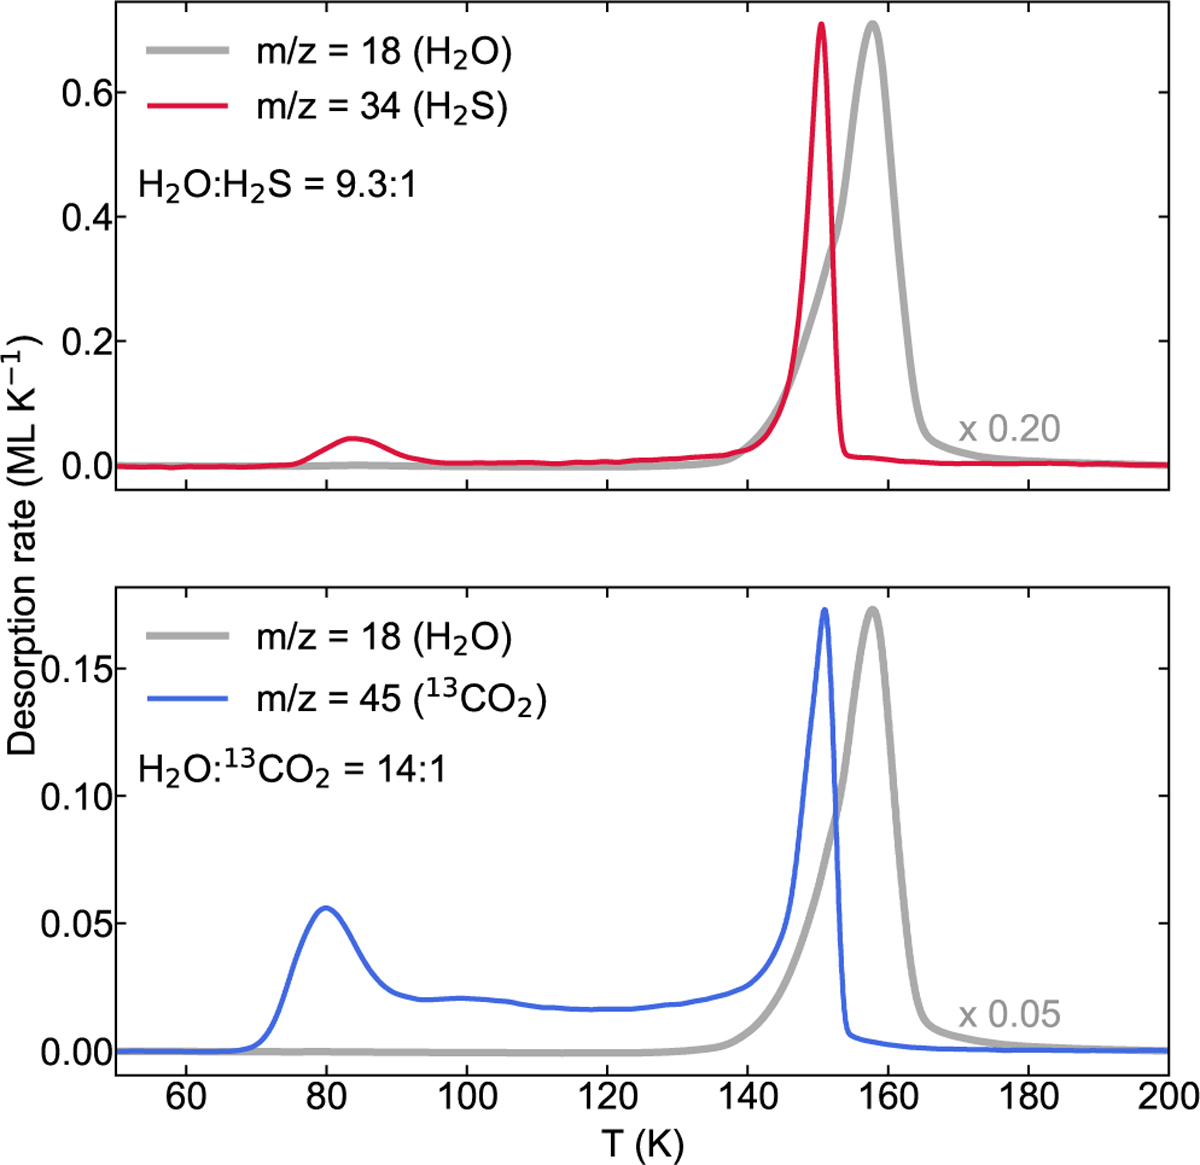
TPD curves of two mixed-ice experiments, H2O:H2S = 9.3:1 (top) and H2O:13CO2 = 14:1 (bottom). The desorption data of H2O, H2S, and 13CO2 are shown in gray (m/z = 18, [H2O]+), red (m/z = 34, [H2S]+), and blue (m/z = 45, [13CO2]+), respectively. Two desorption regimes are seen for H2S: a submonolayer H2S-H2O desorption feature and a molecular volcano desorption peak. For 13CO2, a third regime is observed between its submonolayer and volcano peaks, indicating constant sublimation within that temperature range.
Current usage metrics show cumulative count of Article Views (full-text article views including HTML views, PDF and ePub downloads, according to the available data) and Abstracts Views on Vision4Press platform.
Data correspond to usage on the plateform after 2015. The current usage metrics is available 48-96 hours after online publication and is updated daily on week days.
Initial download of the metrics may take a while.