Fig. 5
Download original image
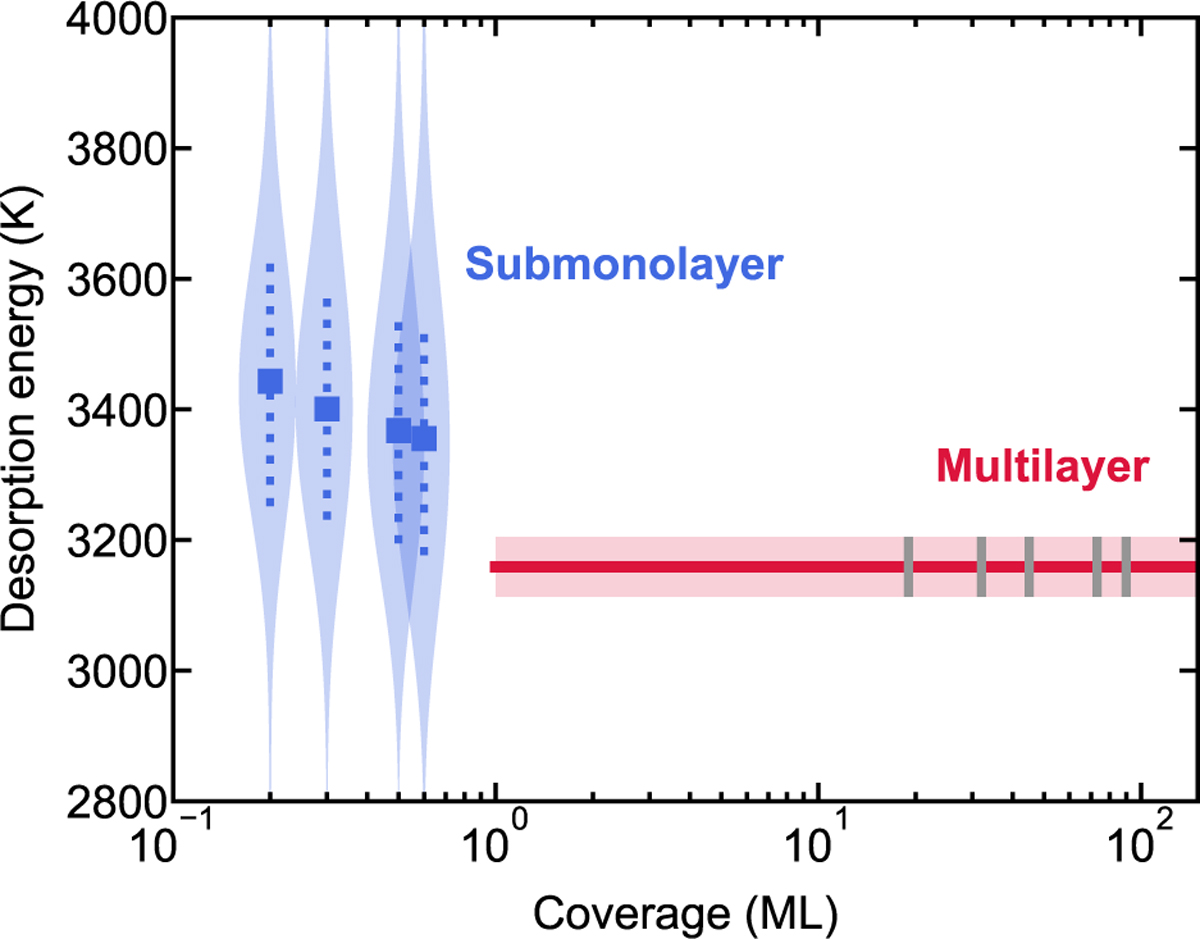
Desorption energies derived experimentally in this work as a function of H2S ice thickness. For the submonolayer regime, the binding energies are represented by blue violin plots, where the square markers indicate the mean binding energies, and the vertical dotted lines show the FWHMs of the Gaussian fits to the binding energy distributions for each coverage. The contour of each violin plot reflects the full range of the sampled binding energy distribution, with its thickness normalized according to the statistical weights (or fractional coverages) of each Eb value. The multilayer binding energy is depicted as a solid red line with its uncertainty shown by the light red shadowed area. The five different ice coverages used to derive the multilayer Eb are shown as gray vertical lines.
Current usage metrics show cumulative count of Article Views (full-text article views including HTML views, PDF and ePub downloads, according to the available data) and Abstracts Views on Vision4Press platform.
Data correspond to usage on the plateform after 2015. The current usage metrics is available 48-96 hours after online publication and is updated daily on week days.
Initial download of the metrics may take a while.