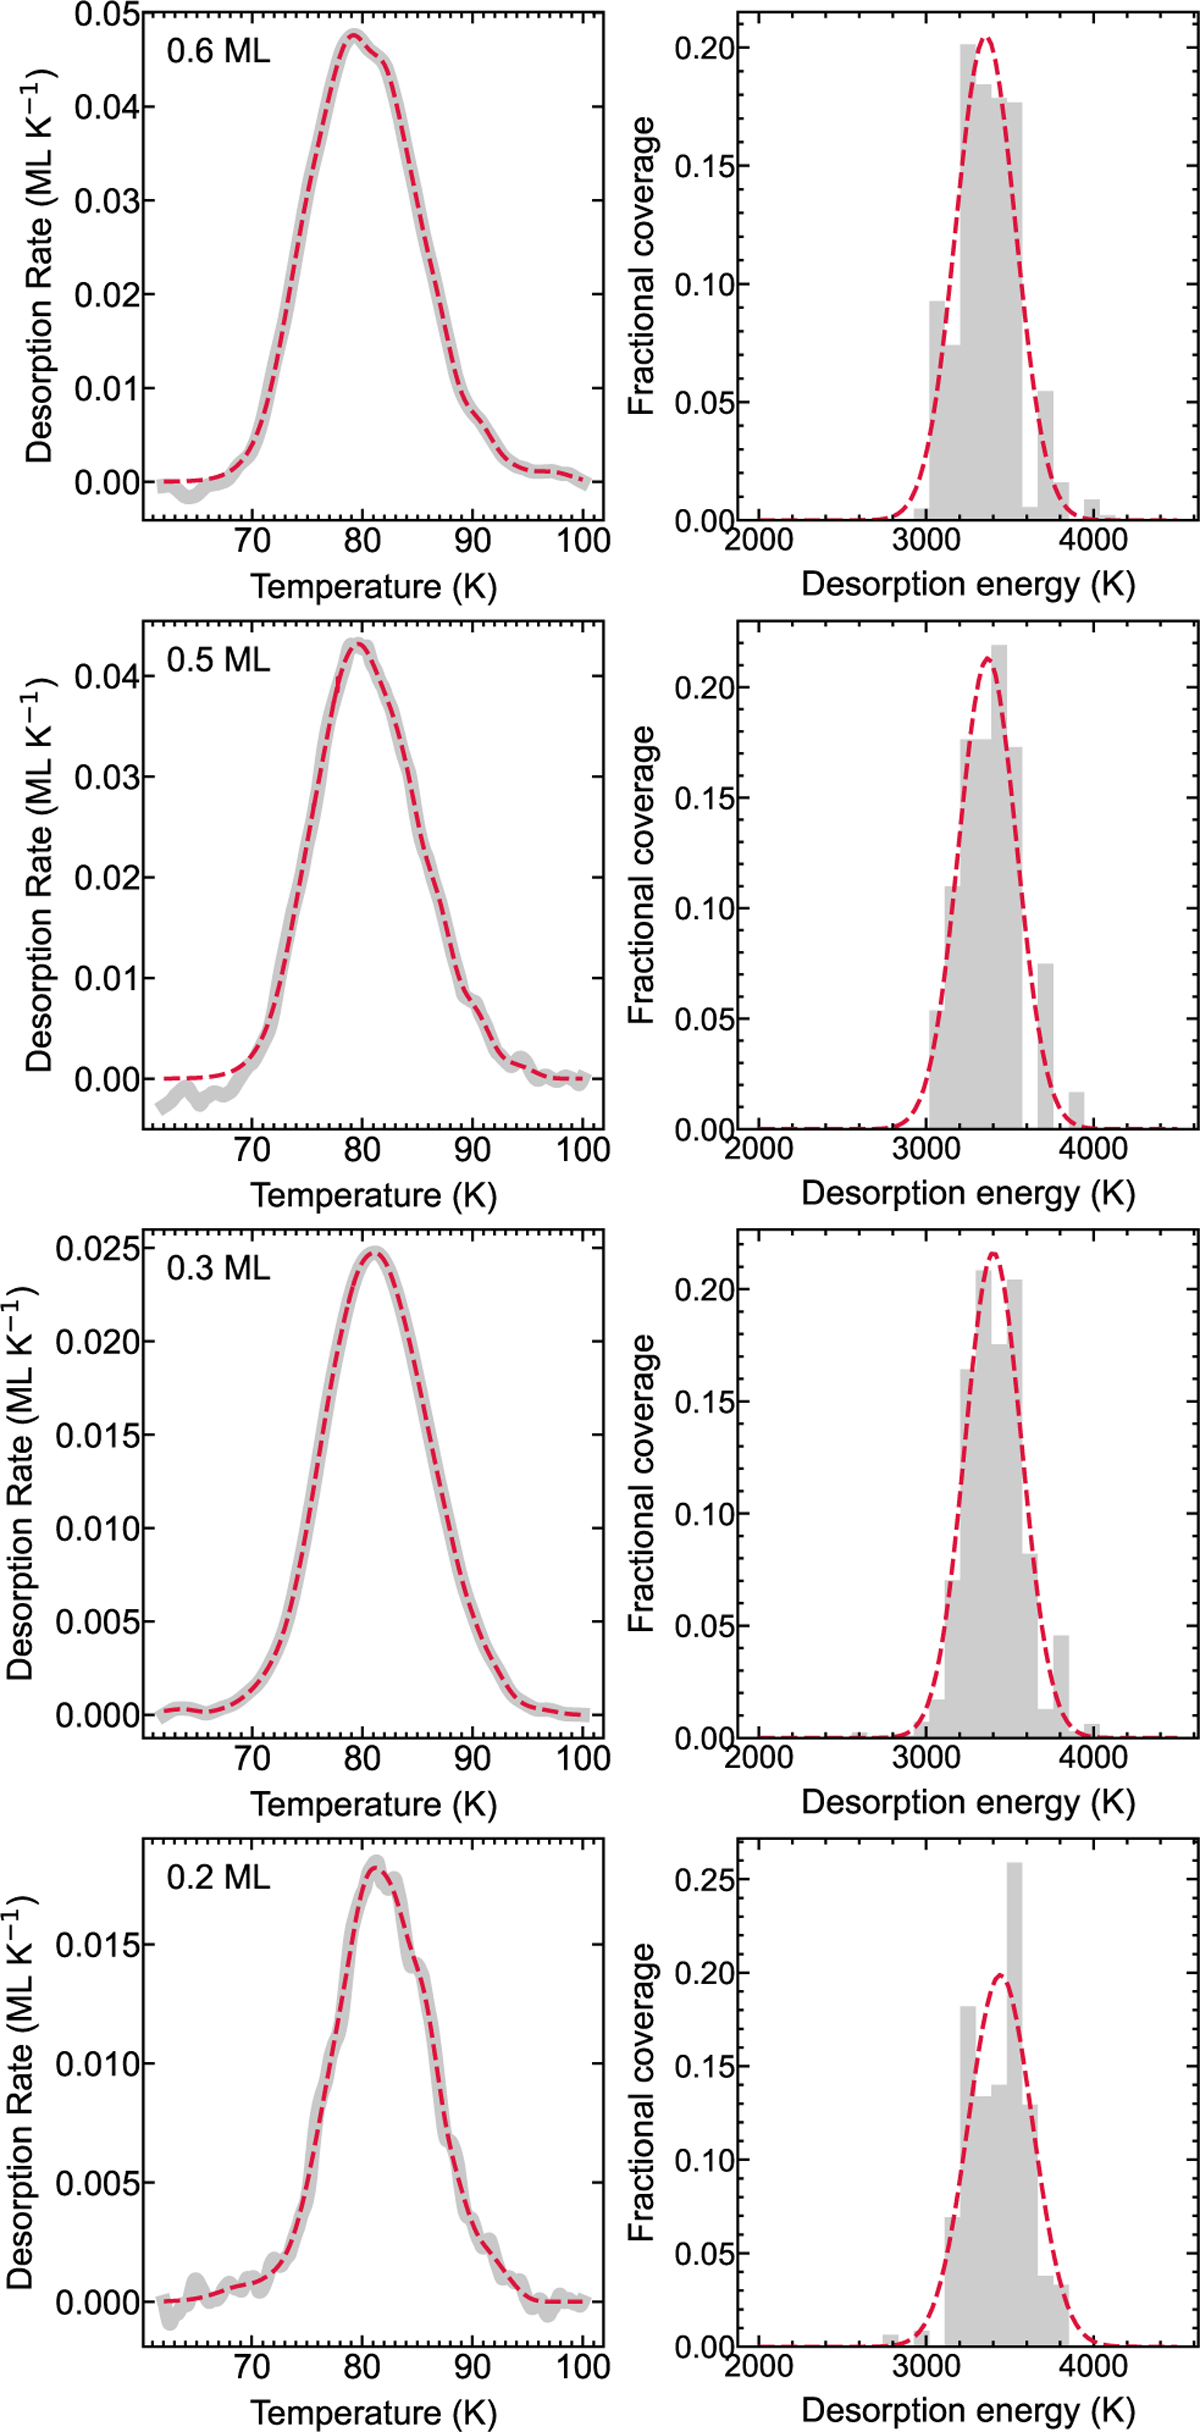
Fig. 4
Download original image
Results of the fits to the submonolayer H2S ice data. Each row corresponds to a different H2S ice thickness: ∼0.6, ∼0.5, ∼0.3, and ∼0.2 ML (from top to bottom). Left panels: TPD curves, with the experimental data in gray and the fits with a linear combination of first-order Polanyi-Wigner equations in red. Right panels: corresponding binding energy distribution: normalized fractional coverages are shown as a functional of the binding energy (gray histogram), superimposed by a Gaussian fit to the distribution (dashed red line).
Current usage metrics show cumulative count of Article Views (full-text article views including HTML views, PDF and ePub downloads, according to the available data) and Abstracts Views on Vision4Press platform.
Data correspond to usage on the plateform after 2015. The current usage metrics is available 48-96 hours after online publication and is updated daily on week days.
Initial download of the metrics may take a while.