Fig. C.1
Download original image
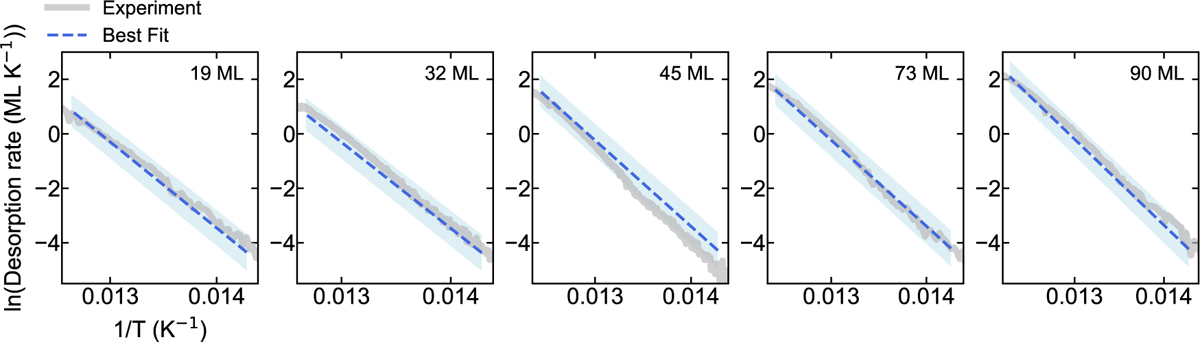
Arrhenius plots of the multilayer H2S TPD curves used to derive the H2S-H2S binding energy. The experimental data are shown in gray, and the linear fits to the plots, performed simultaneously for the five ice thicknesses, with the dashed blue lines. The shaded blue region indicates the 1σ uncertainty. The fit is performed for the temperature range where the original curve follows an exponential trend (see Sect. 3.1.1).
Current usage metrics show cumulative count of Article Views (full-text article views including HTML views, PDF and ePub downloads, according to the available data) and Abstracts Views on Vision4Press platform.
Data correspond to usage on the plateform after 2015. The current usage metrics is available 48-96 hours after online publication and is updated daily on week days.
Initial download of the metrics may take a while.