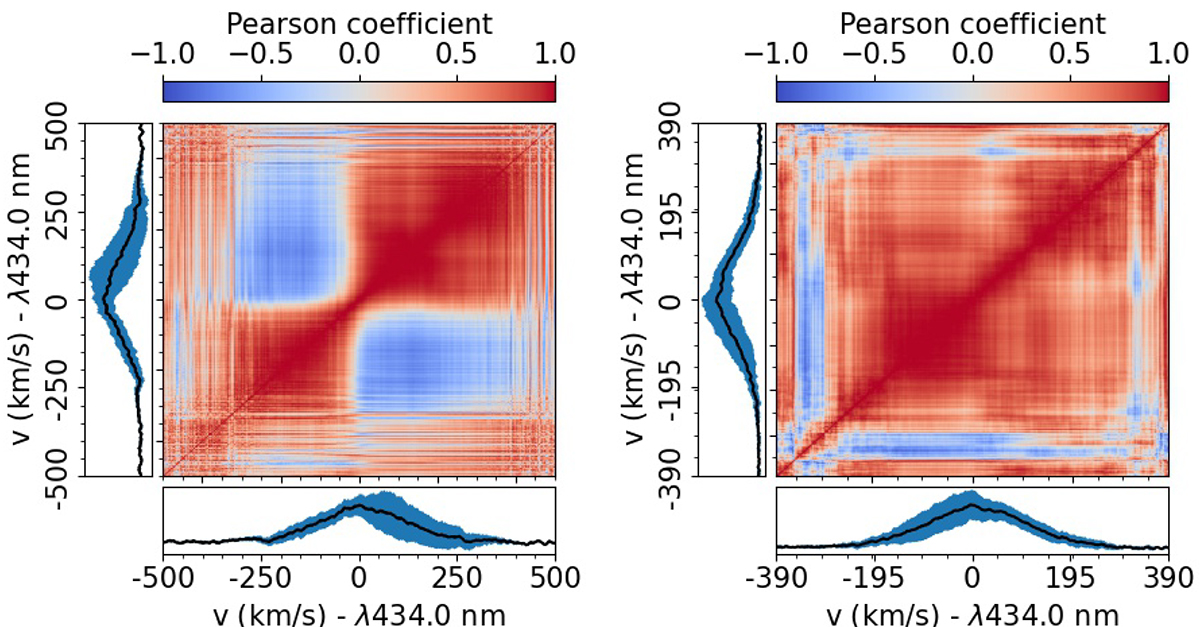
Fig. 5.
Download original image
Hγ residual line autocorrelation matrix in the velocity frame of the primary (left) and secondary (right). The colour-code scales the correlation coefficient: red represents a strong correlation and blue shows a strong anti-correlation. The plots along the x- and y-axes represent the corresponding mean line profile (black) and its variance (blue).
Current usage metrics show cumulative count of Article Views (full-text article views including HTML views, PDF and ePub downloads, according to the available data) and Abstracts Views on Vision4Press platform.
Data correspond to usage on the plateform after 2015. The current usage metrics is available 48-96 hours after online publication and is updated daily on week days.
Initial download of the metrics may take a while.