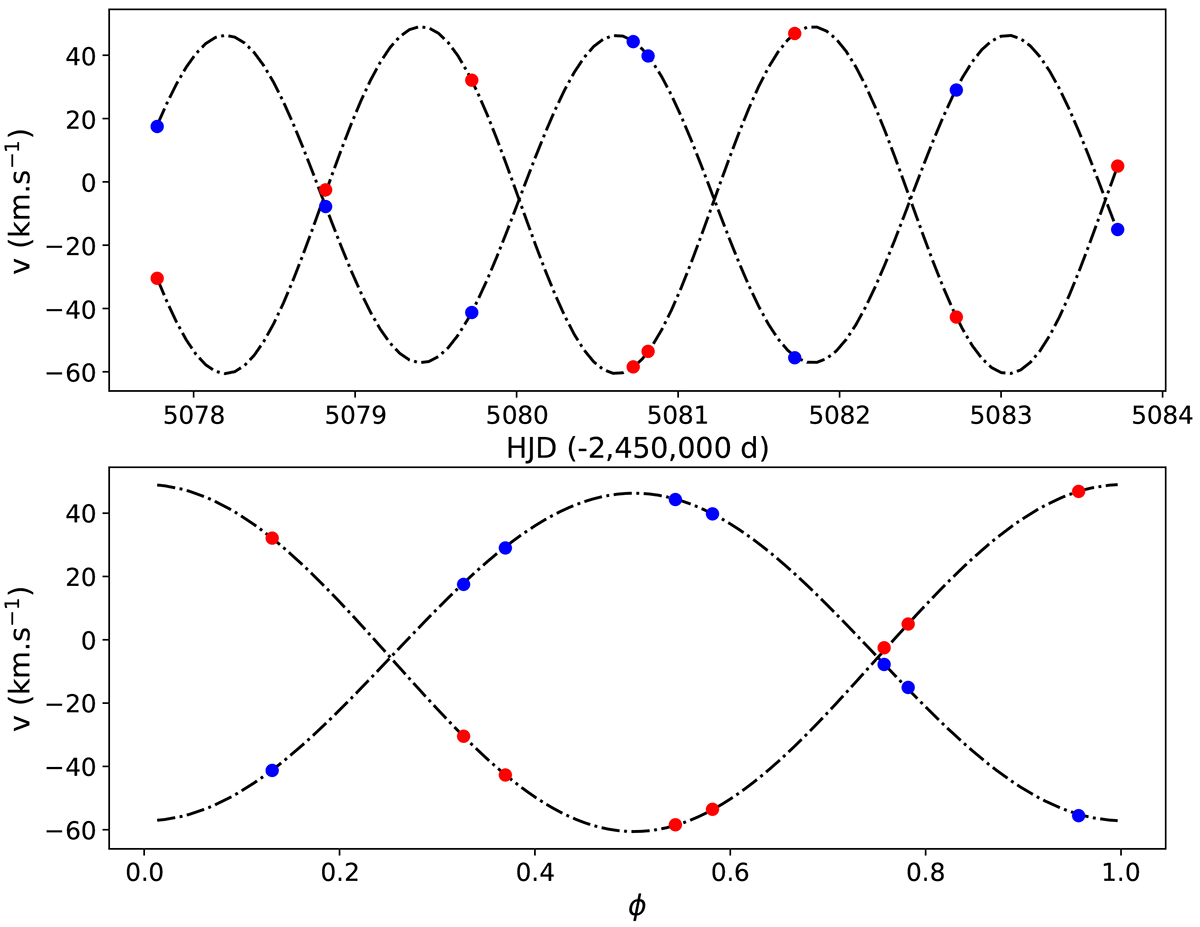
Fig. 2.
Download original image
Radial velocity curves of the primary (blue) and secondary (red) components of V4046 Sgr. The top panel represents velocity as function of the HJD, while the bottom panel shows the curve folded in phase using the ephemeris of Eq. (1). The dash-dotted curve shows the orbital solution using the parameters of Table 2. The error bars are included in this plot, but are smaller than the marker sizes.
Current usage metrics show cumulative count of Article Views (full-text article views including HTML views, PDF and ePub downloads, according to the available data) and Abstracts Views on Vision4Press platform.
Data correspond to usage on the plateform after 2015. The current usage metrics is available 48-96 hours after online publication and is updated daily on week days.
Initial download of the metrics may take a while.