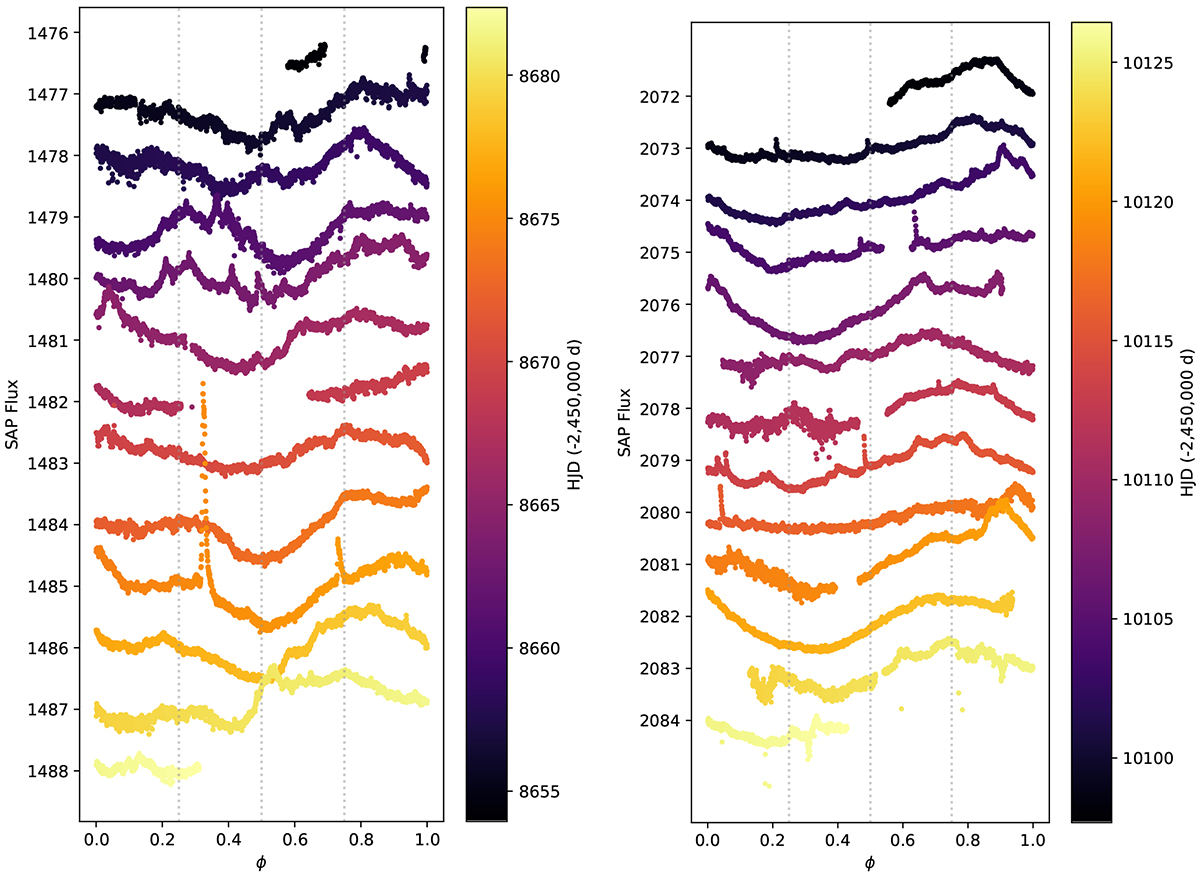
Fig. C.1.
Download original image
Sector 13 (left) and 66 (right) TESS light curves folded in phase following Eq. 1. The different cycles have been shifted vertically to improve the readability. The vertical grey dotted lines illustrate the phase 0.25 (component A is in front of the observer), 0.5, and 0.75 (component B is facing the observer). The y-axis labels denote the orbital cycle from the first ESPaDOnS observation used in this work.
Current usage metrics show cumulative count of Article Views (full-text article views including HTML views, PDF and ePub downloads, according to the available data) and Abstracts Views on Vision4Press platform.
Data correspond to usage on the plateform after 2015. The current usage metrics is available 48-96 hours after online publication and is updated daily on week days.
Initial download of the metrics may take a while.