Fig. 15.
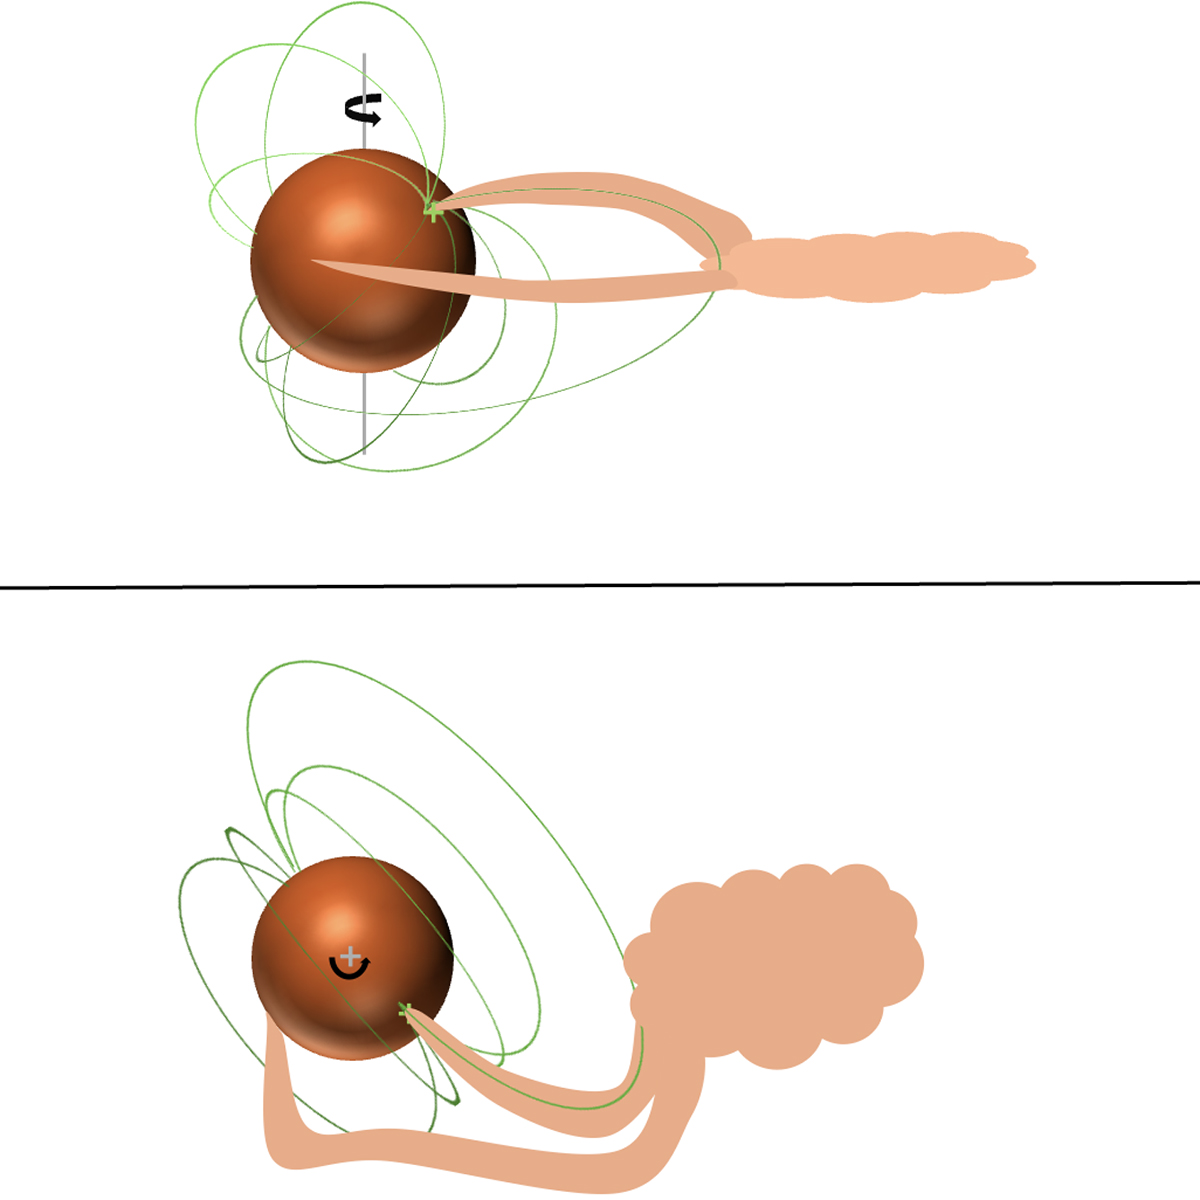
Download original image
Sketch representing the first hypothesis for the 0.3 d−1 period detected where the primary shows both an accretion funnel flow and an accretion tongue. The top panel shows the side view, the bottom panel represents the polar view. The grey line or cross is the rotation axis, the green cross is the dipole pole, the green lines are the dipole magnetic field lines. The cloud represents the bulk of gas mentioned in Sect. 4.
Current usage metrics show cumulative count of Article Views (full-text article views including HTML views, PDF and ePub downloads, according to the available data) and Abstracts Views on Vision4Press platform.
Data correspond to usage on the plateform after 2015. The current usage metrics is available 48-96 hours after online publication and is updated daily on week days.
Initial download of the metrics may take a while.