Fig. 4
Download original image
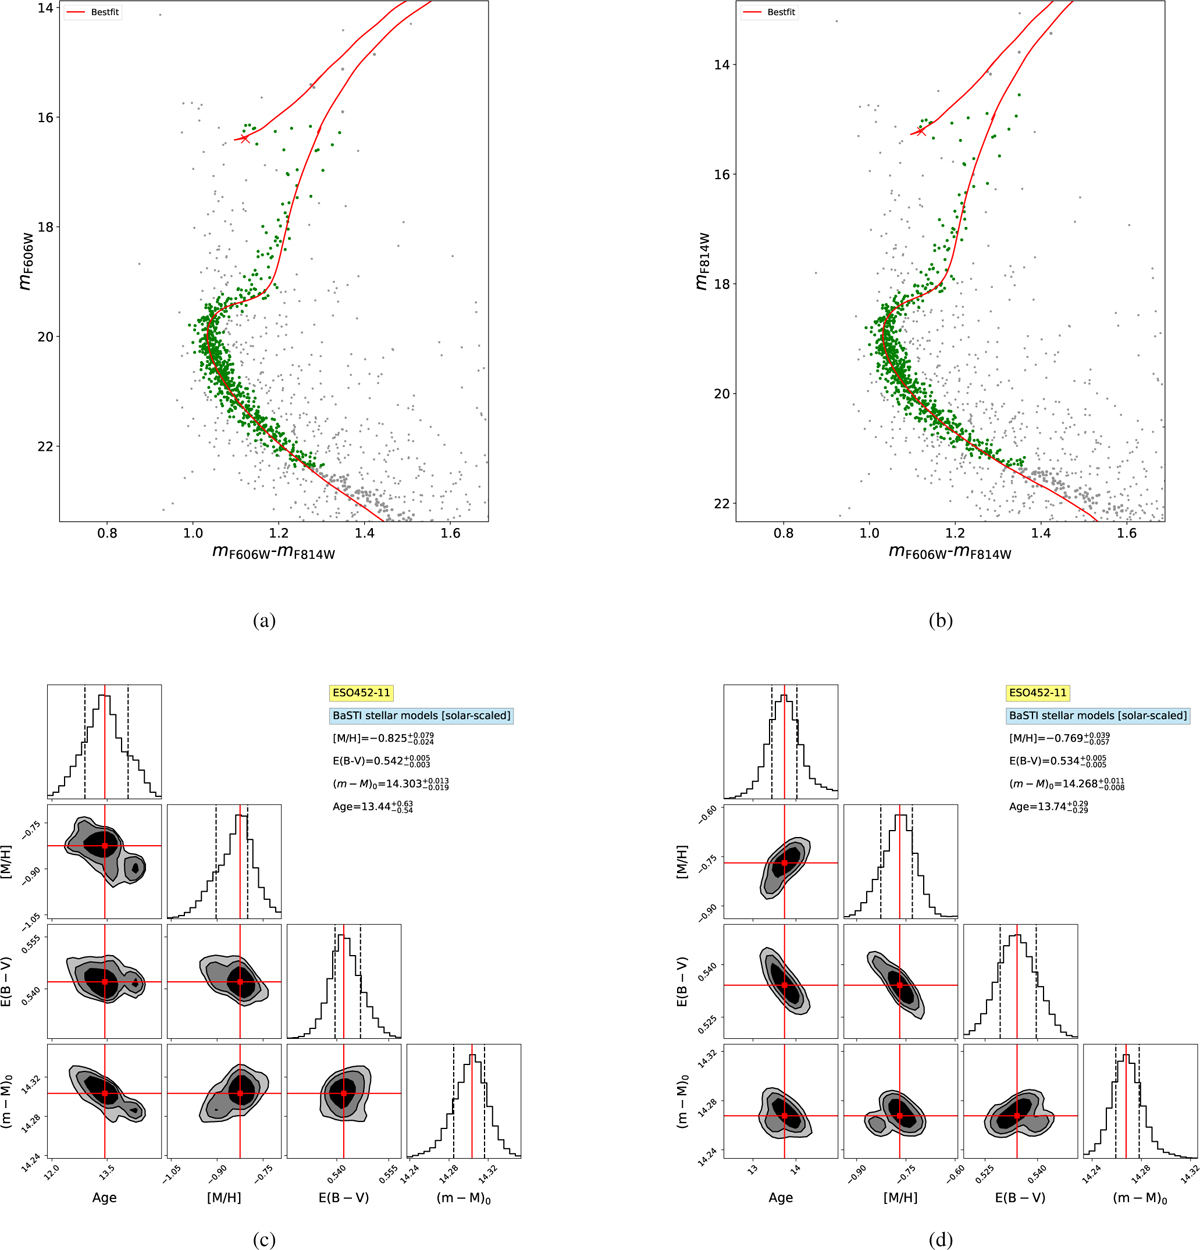
Results of the isochrone fitting for ESO452-11. Panels a) and b) show the (mF606W − mF814W, mF606W) and the (mF606W − mF814W, mF814W) CMDs, respectively. The grey symbols describe the whole sample of stars in the cluster catalogue, while green symbols show the stars effectively used for the isochrone fit, selected as described in the text. The red line corresponds to the best-fit model. Panels c) and d) show the corresponding corner plots of the MCMC sampling.
Current usage metrics show cumulative count of Article Views (full-text article views including HTML views, PDF and ePub downloads, according to the available data) and Abstracts Views on Vision4Press platform.
Data correspond to usage on the plateform after 2015. The current usage metrics is available 48-96 hours after online publication and is updated daily on week days.
Initial download of the metrics may take a while.