Open Access
Fig. 3
Download original image
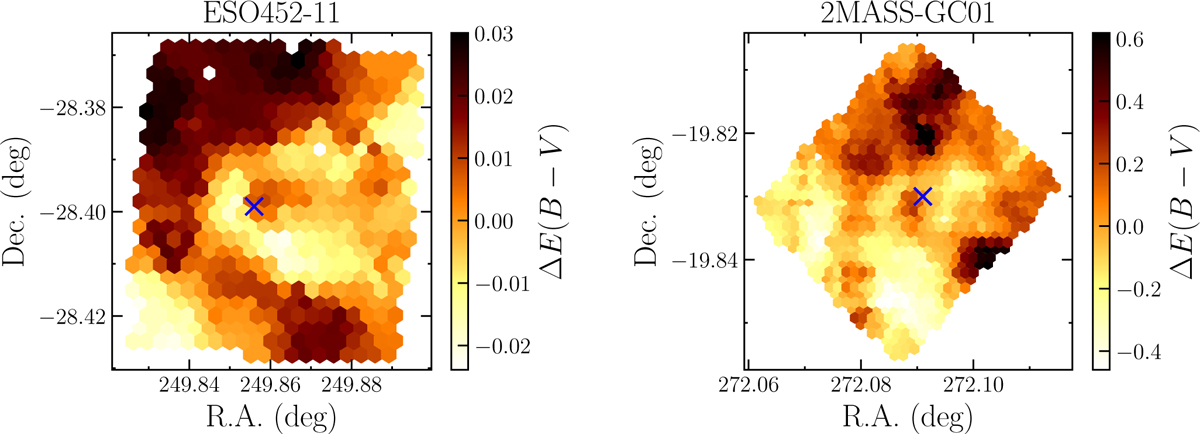
Differential reddening maps for ESO452-11 (left panel) and 2MASS-GC01 (right panel). Please note the very different amplitude of the ΔE(B − V) scale in the two panels. The centre of the clusters as quoted in Harris (1996, 2010 edition) is shown as a blue cross.
Current usage metrics show cumulative count of Article Views (full-text article views including HTML views, PDF and ePub downloads, according to the available data) and Abstracts Views on Vision4Press platform.
Data correspond to usage on the plateform after 2015. The current usage metrics is available 48-96 hours after online publication and is updated daily on week days.
Initial download of the metrics may take a while.