Fig. 8
Download original image
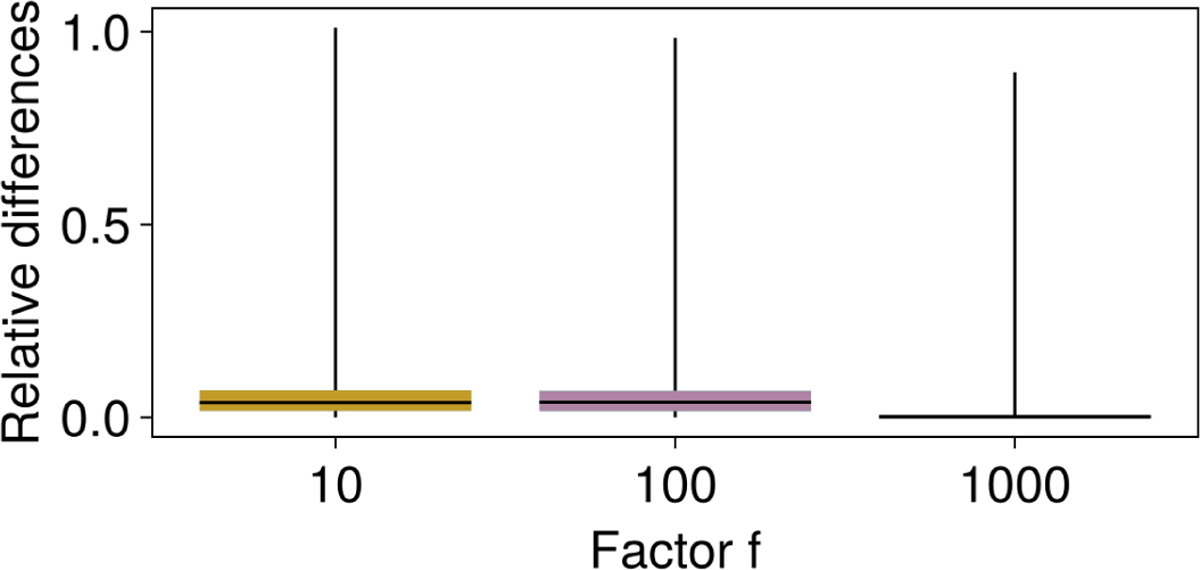
Distributions of the relative differences in abundances for several values of f, using f=10 000 as reference. The horizontal black lines represent the medians of the distributions, the colored boxes range from the first to the third quartiles, and the vertical black lines span from the minimum to the maximum values. For the f = 1000 case, the colored box is not visible as its upper limit stands at a value of 0.001.
Current usage metrics show cumulative count of Article Views (full-text article views including HTML views, PDF and ePub downloads, according to the available data) and Abstracts Views on Vision4Press platform.
Data correspond to usage on the plateform after 2015. The current usage metrics is available 48-96 hours after online publication and is updated daily on week days.
Initial download of the metrics may take a while.