Fig. 5
Download original image
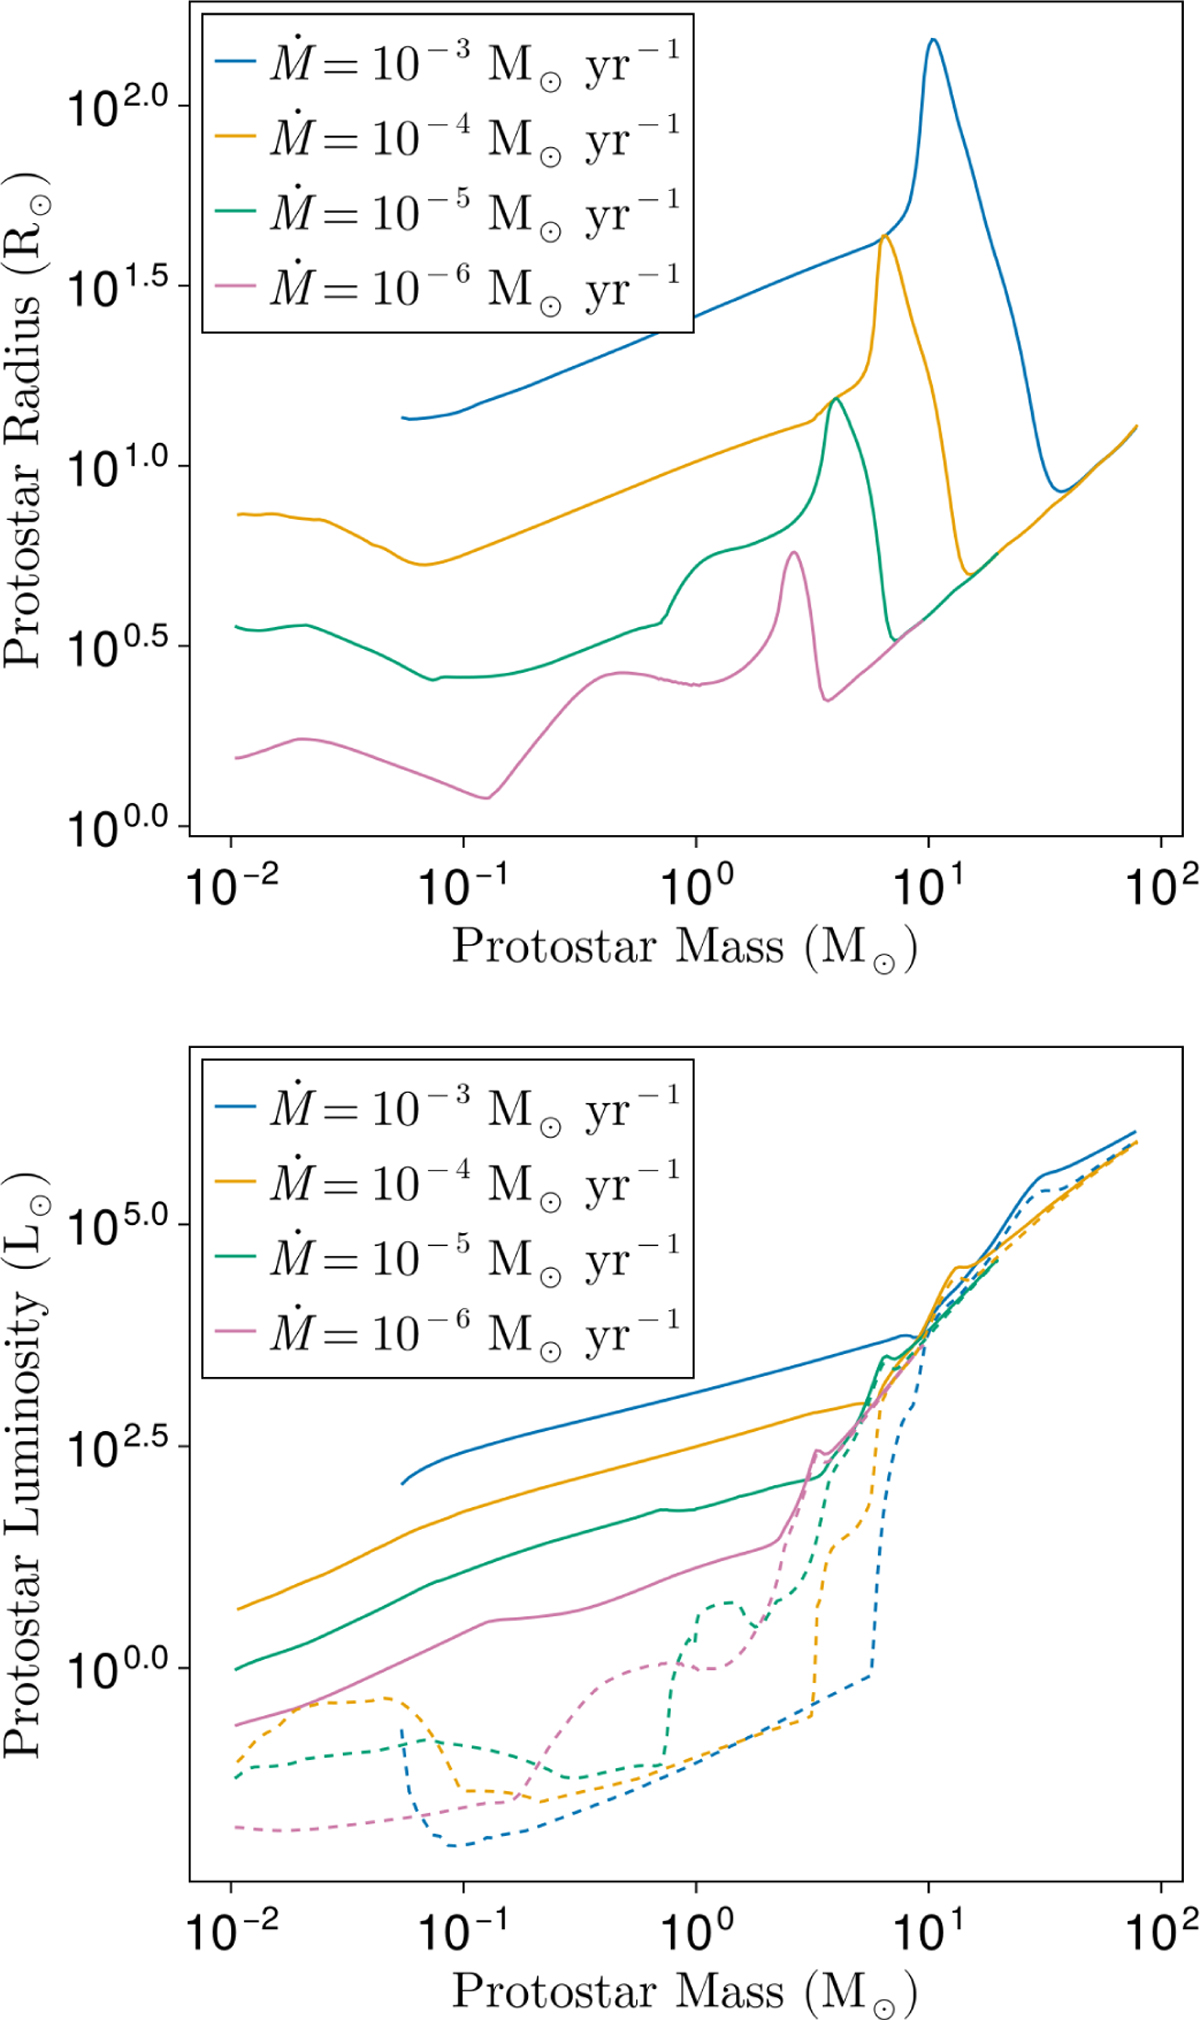
Upper panel: mass–radius relation of central objects for different accretion rates, from the tabulated results of Hosokawa & Omukai (2009). Bottom panel: same as upper panel for the mass-luminosity relation. The solid lines represent the total central object luminosity L*, while dashed lines represent only the photometric luminosity (excluding the accretion luminosity).
Current usage metrics show cumulative count of Article Views (full-text article views including HTML views, PDF and ePub downloads, according to the available data) and Abstracts Views on Vision4Press platform.
Data correspond to usage on the plateform after 2015. The current usage metrics is available 48-96 hours after online publication and is updated daily on week days.
Initial download of the metrics may take a while.