Open Access
Fig. 13
Download original image
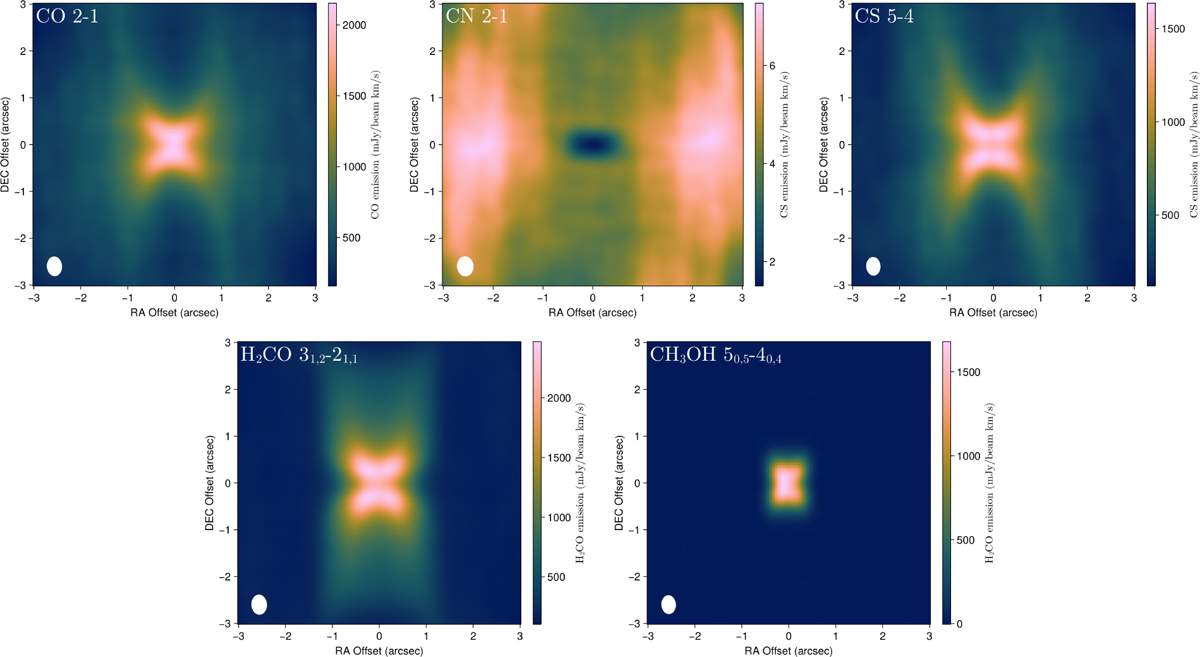
Moment 0 map of the molecular emission for an edge-on configuration, zoomed on the inner 6″. The white ellipse on the bottom left represents the beam size. From left to right, top to bottom: CO 2–1, CN 2–1, CS 5–4, H2CO 31,2−21,1, CH3OH 50,5−40,4.
Current usage metrics show cumulative count of Article Views (full-text article views including HTML views, PDF and ePub downloads, according to the available data) and Abstracts Views on Vision4Press platform.
Data correspond to usage on the plateform after 2015. The current usage metrics is available 48-96 hours after online publication and is updated daily on week days.
Initial download of the metrics may take a while.