Fig. 12
Download original image
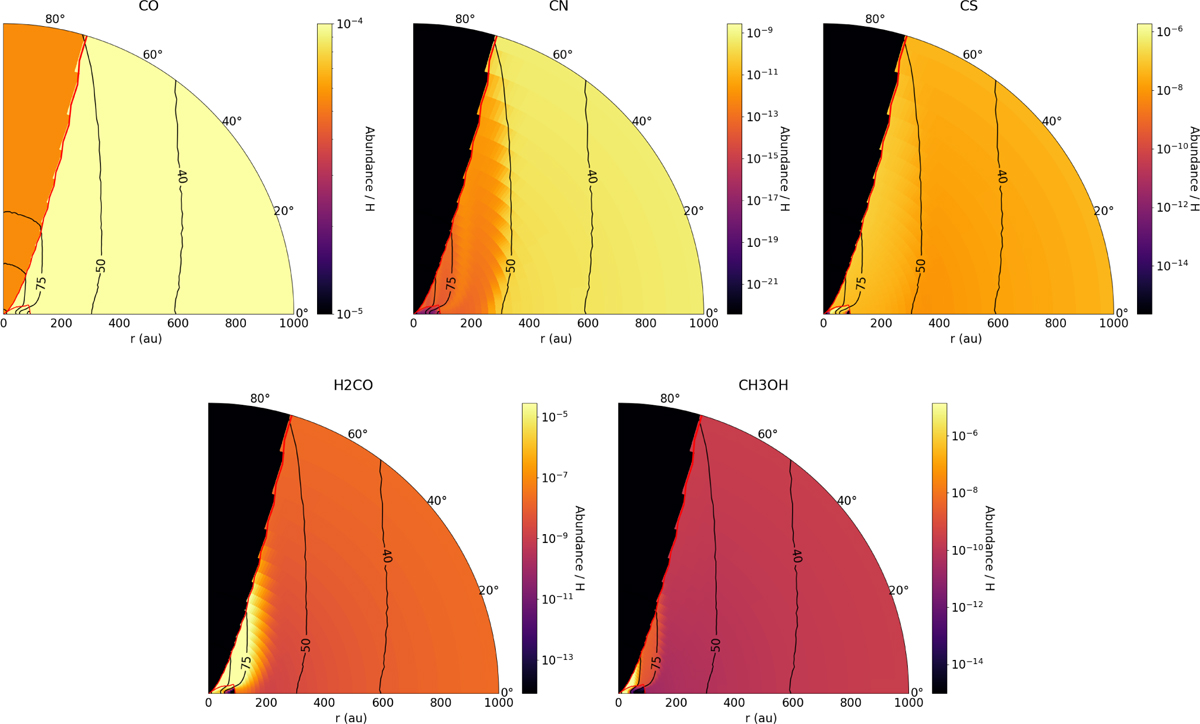
Reconstructed maps of relative gas phase abundances of CO (top left), CN (top middle), CS (top right), H2CO (bottom left), and CH3OH (bottom right), 150 kyr after the formation of the central object. The black contours represent temperatures of 40, 50, 75,100 and 300 K. The red contours delimitate the envelope, the disk and the outflow.
Current usage metrics show cumulative count of Article Views (full-text article views including HTML views, PDF and ePub downloads, according to the available data) and Abstracts Views on Vision4Press platform.
Data correspond to usage on the plateform after 2015. The current usage metrics is available 48-96 hours after online publication and is updated daily on week days.
Initial download of the metrics may take a while.