Fig. 5.
Download original image
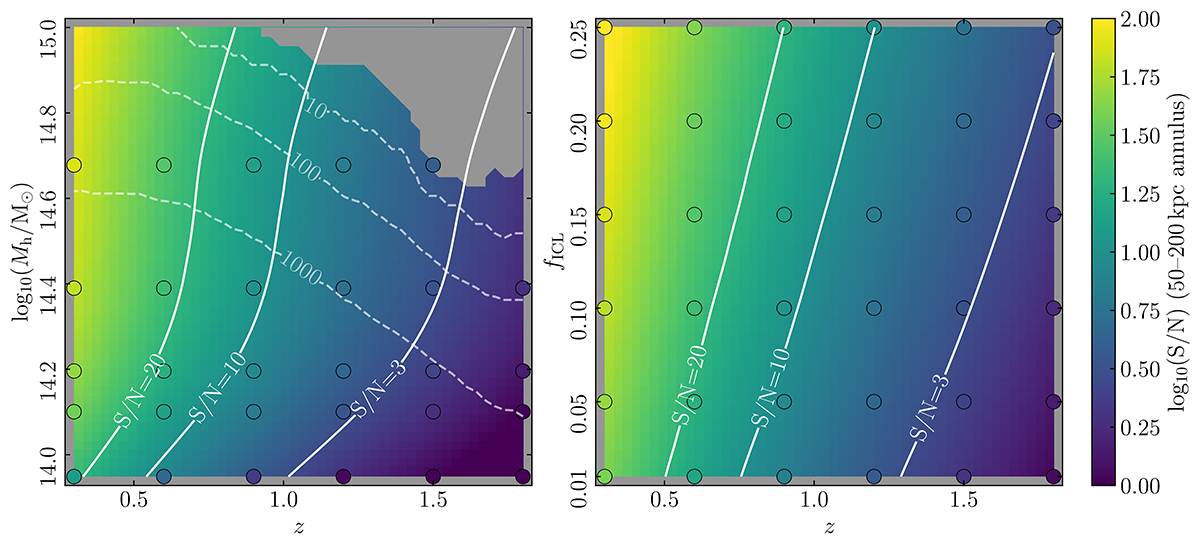
Left: HE-band S/N of the ICL + BCG measured within a 50–200 kpc annulus, interpolated across halo mass and redshift space, using ‘smoothed’ ICL parameters calculated as described in Appendix B and assuming a fixed ICL fraction of 15%. Coloured circles indicate the S/N values from the individual model clusters for comparison. Contours indicate the lines corresponding to a S/N = 3, 10 and 20 as labelled. Dashed contours indicate the threshold halo mass above which the total number of clusters in a redshift bin of Δz = 0.1 is expected to be 10, 100, and 1000, across the footprint of the EWS, calculated as described in Sect. 6. By the same estimates, the grey shaded region to the upper-right indicates the parameter space in which we expect to find no clusters according to the halo mass function. Right: HE-band S/N of the BCG + ICL measured within a 50–200 kpc annulus, interpolated across ICL fraction and redshift space, for a cluster with Mh = 1014.7 M⊙. The term fICL is defined as the total flux of the ICL across its entire radial extent divided by the combined total fluxes of the ICL, BCG, and cluster galaxies. Circles indicate the locations at which the ICL S/N has been measured to produce the interpolated map.
Current usage metrics show cumulative count of Article Views (full-text article views including HTML views, PDF and ePub downloads, according to the available data) and Abstracts Views on Vision4Press platform.
Data correspond to usage on the plateform after 2015. The current usage metrics is available 48-96 hours after online publication and is updated daily on week days.
Initial download of the metrics may take a while.