Fig. 3.
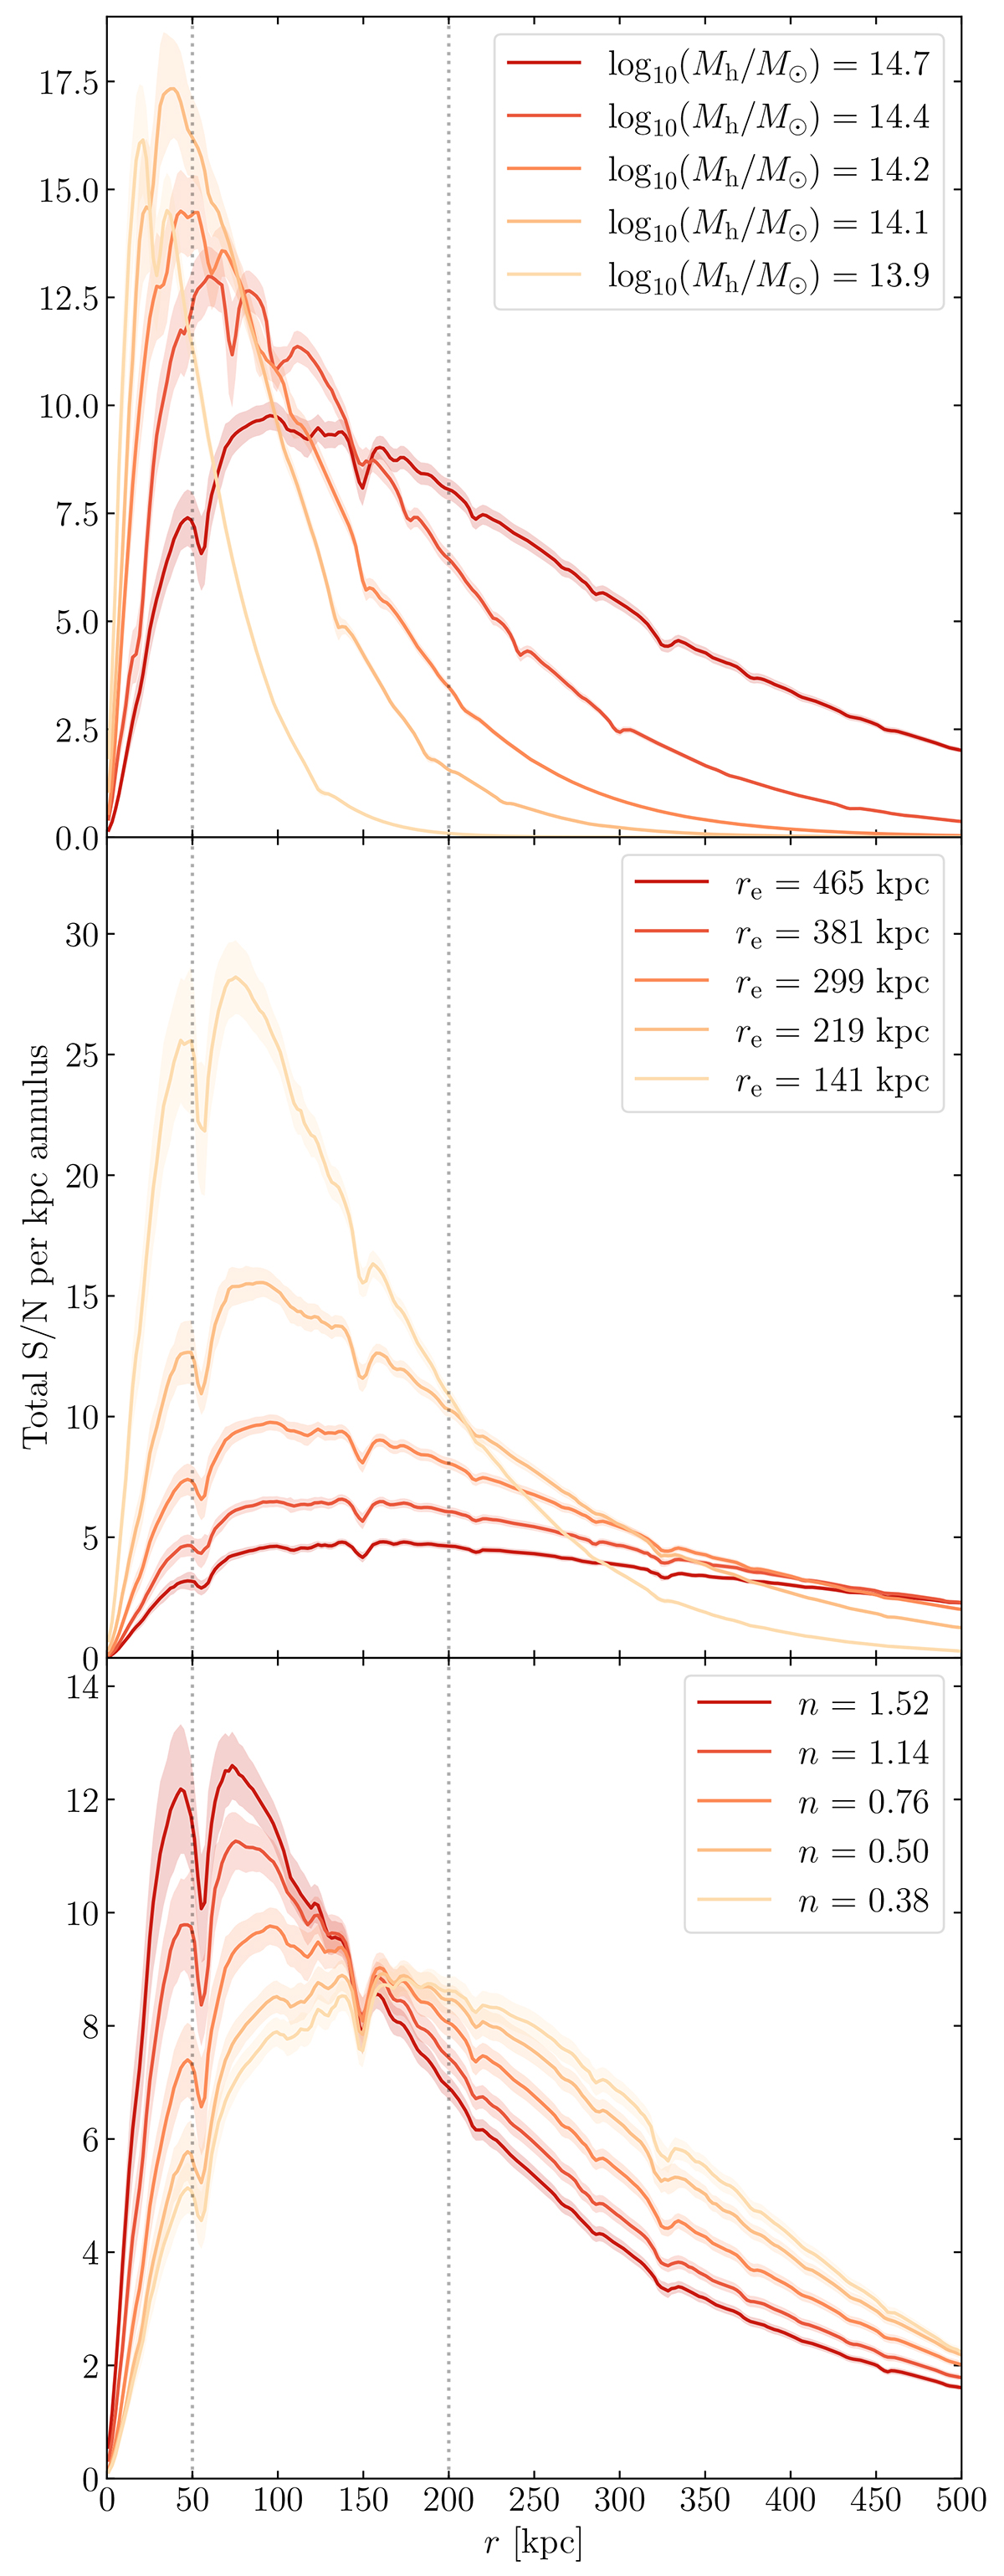
Download original image
Signal-to-noise ratio per kiloparsec annulus versus radius for clusters of varying halo mass (top), ICL effective radius (middle), and ICL Sérsic index (bottom) measured on the isolated ICL component (not including BCG) within 2 kpc annuli. The lines and shaded regions respectively show the median value and standard deviation of the S/N across nine instances of the same cluster simulated in different regions of the image. The vertical dotted lines indicate the 50–200 kpc region we selected for the annulus.
Current usage metrics show cumulative count of Article Views (full-text article views including HTML views, PDF and ePub downloads, according to the available data) and Abstracts Views on Vision4Press platform.
Data correspond to usage on the plateform after 2015. The current usage metrics is available 48-96 hours after online publication and is updated daily on week days.
Initial download of the metrics may take a while.