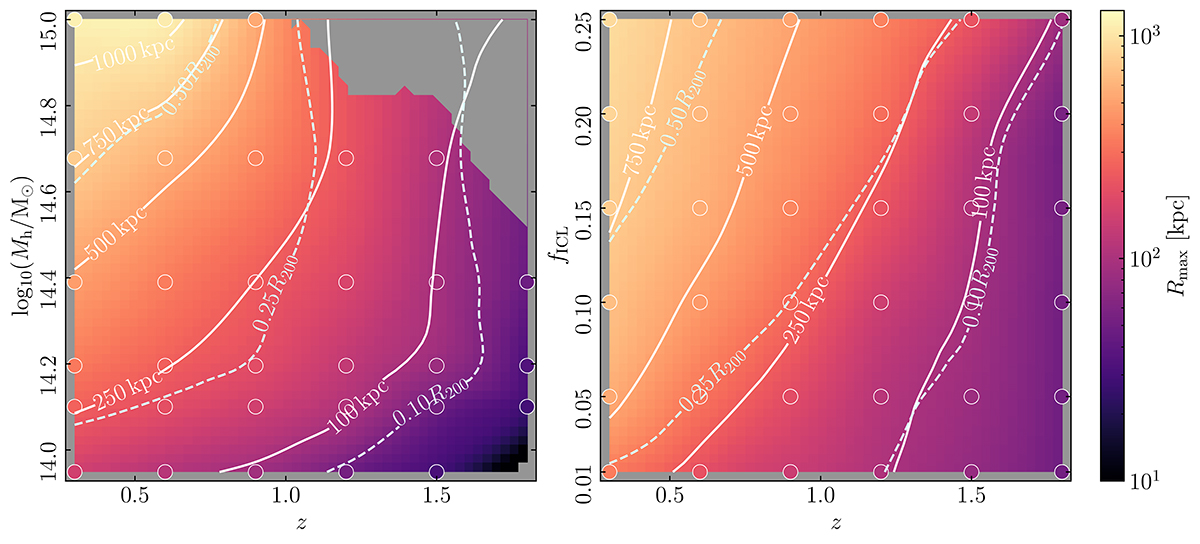
Fig. 12.
Download original image
Maximum radius to which the ICL can be detected, Rmax, interpolated across halo mass, log10 (Mh/M⊙), and redshift, z, for a fixed fICL = 0.15 in the left panel and across ICL fraction, fICL, and redshift, z, for a fixed halo mass, log10 (Mh/M⊙) = 14.7, in the right panel. Coloured circles indicate the measured Rmax values from individual mock clusters. Contours show the limiting radial extent expressed in physical units by the solid lines and in terms of R200 by the dashed lines, where the value of R200 corresponds to a typical cluster at the corresponding location in the parameter space.
Current usage metrics show cumulative count of Article Views (full-text article views including HTML views, PDF and ePub downloads, according to the available data) and Abstracts Views on Vision4Press platform.
Data correspond to usage on the plateform after 2015. The current usage metrics is available 48-96 hours after online publication and is updated daily on week days.
Initial download of the metrics may take a while.