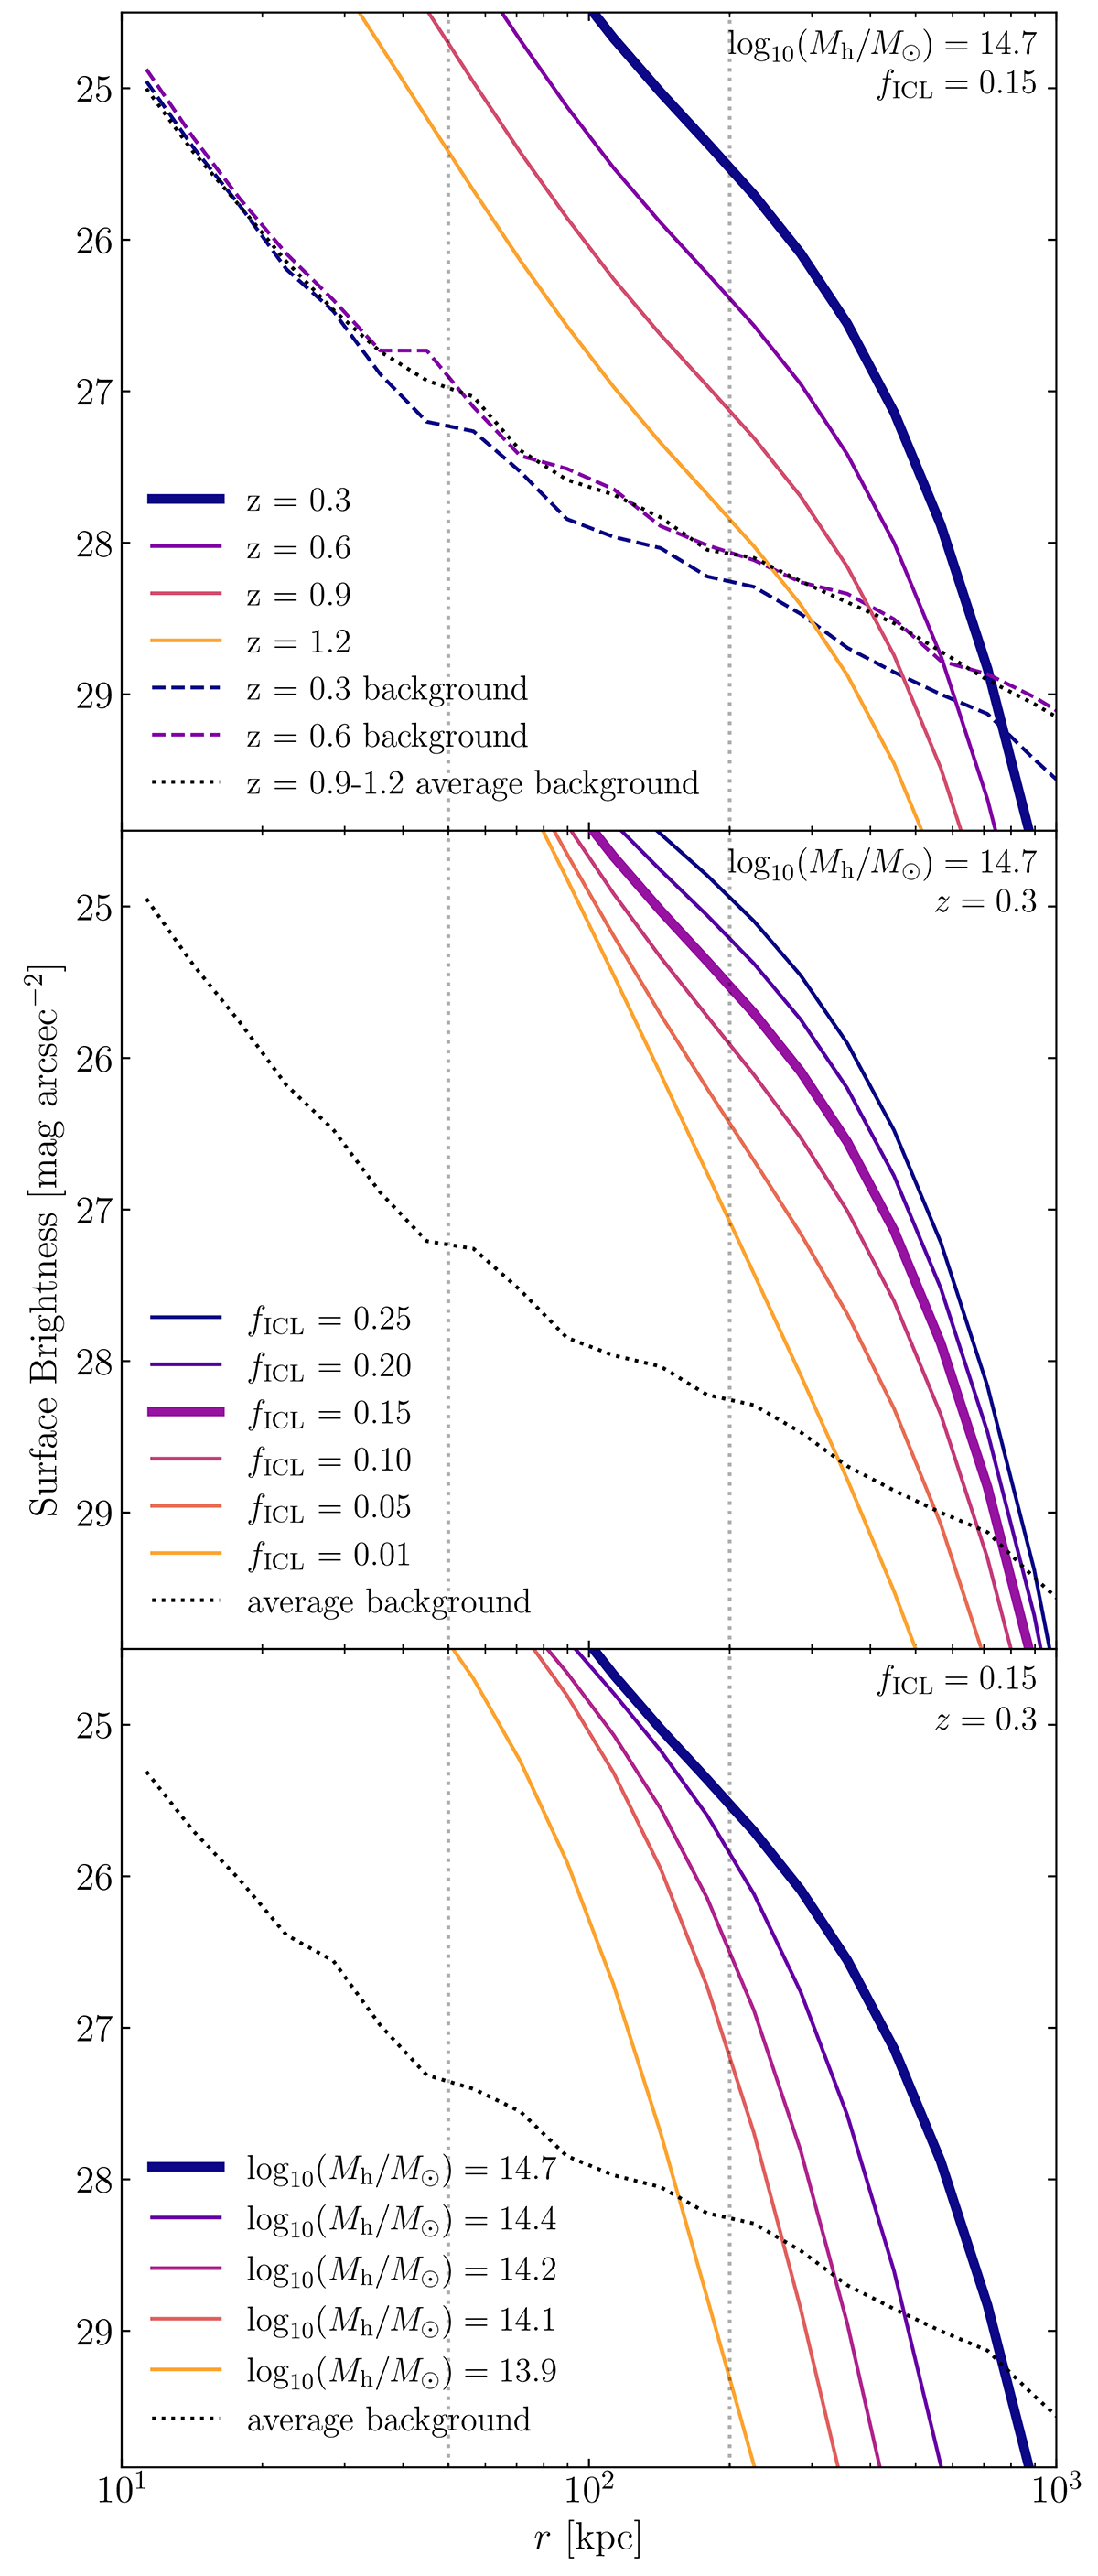
Fig. 11.
Download original image
Expected surface brightness profile of the BCG + ICL (solid coloured lines) and 3σ noise level (dashed lines) for a range of redshifts (z; upper panel), ICL fractions, (fICL; central panel), and halo masses (Mh; lower panel) varying with respect to our fiducial model where z = 0.3, fICL = 0.15, and log10 (Mh/M⊙) = 14.7. Profiles are shown up to redshift 1.2, above which a cluster of this mass is not expected to exist within the area of the EWS (see Fig. 5, grey shaded region). The fiducial model is indicated by a thick line in each panel. Moreover, the black dotted line in each sub-figure is representative of the background noise level for the fiducial model. The noise level depends on the redshift of the cluster (see upper panel), but varies little for z>1.0. The radius to which ICL can be detected increases with fICL and Mh, while decreasing with redshift.
Current usage metrics show cumulative count of Article Views (full-text article views including HTML views, PDF and ePub downloads, according to the available data) and Abstracts Views on Vision4Press platform.
Data correspond to usage on the plateform after 2015. The current usage metrics is available 48-96 hours after online publication and is updated daily on week days.
Initial download of the metrics may take a while.