Open Access
Fig. 8
Download original image
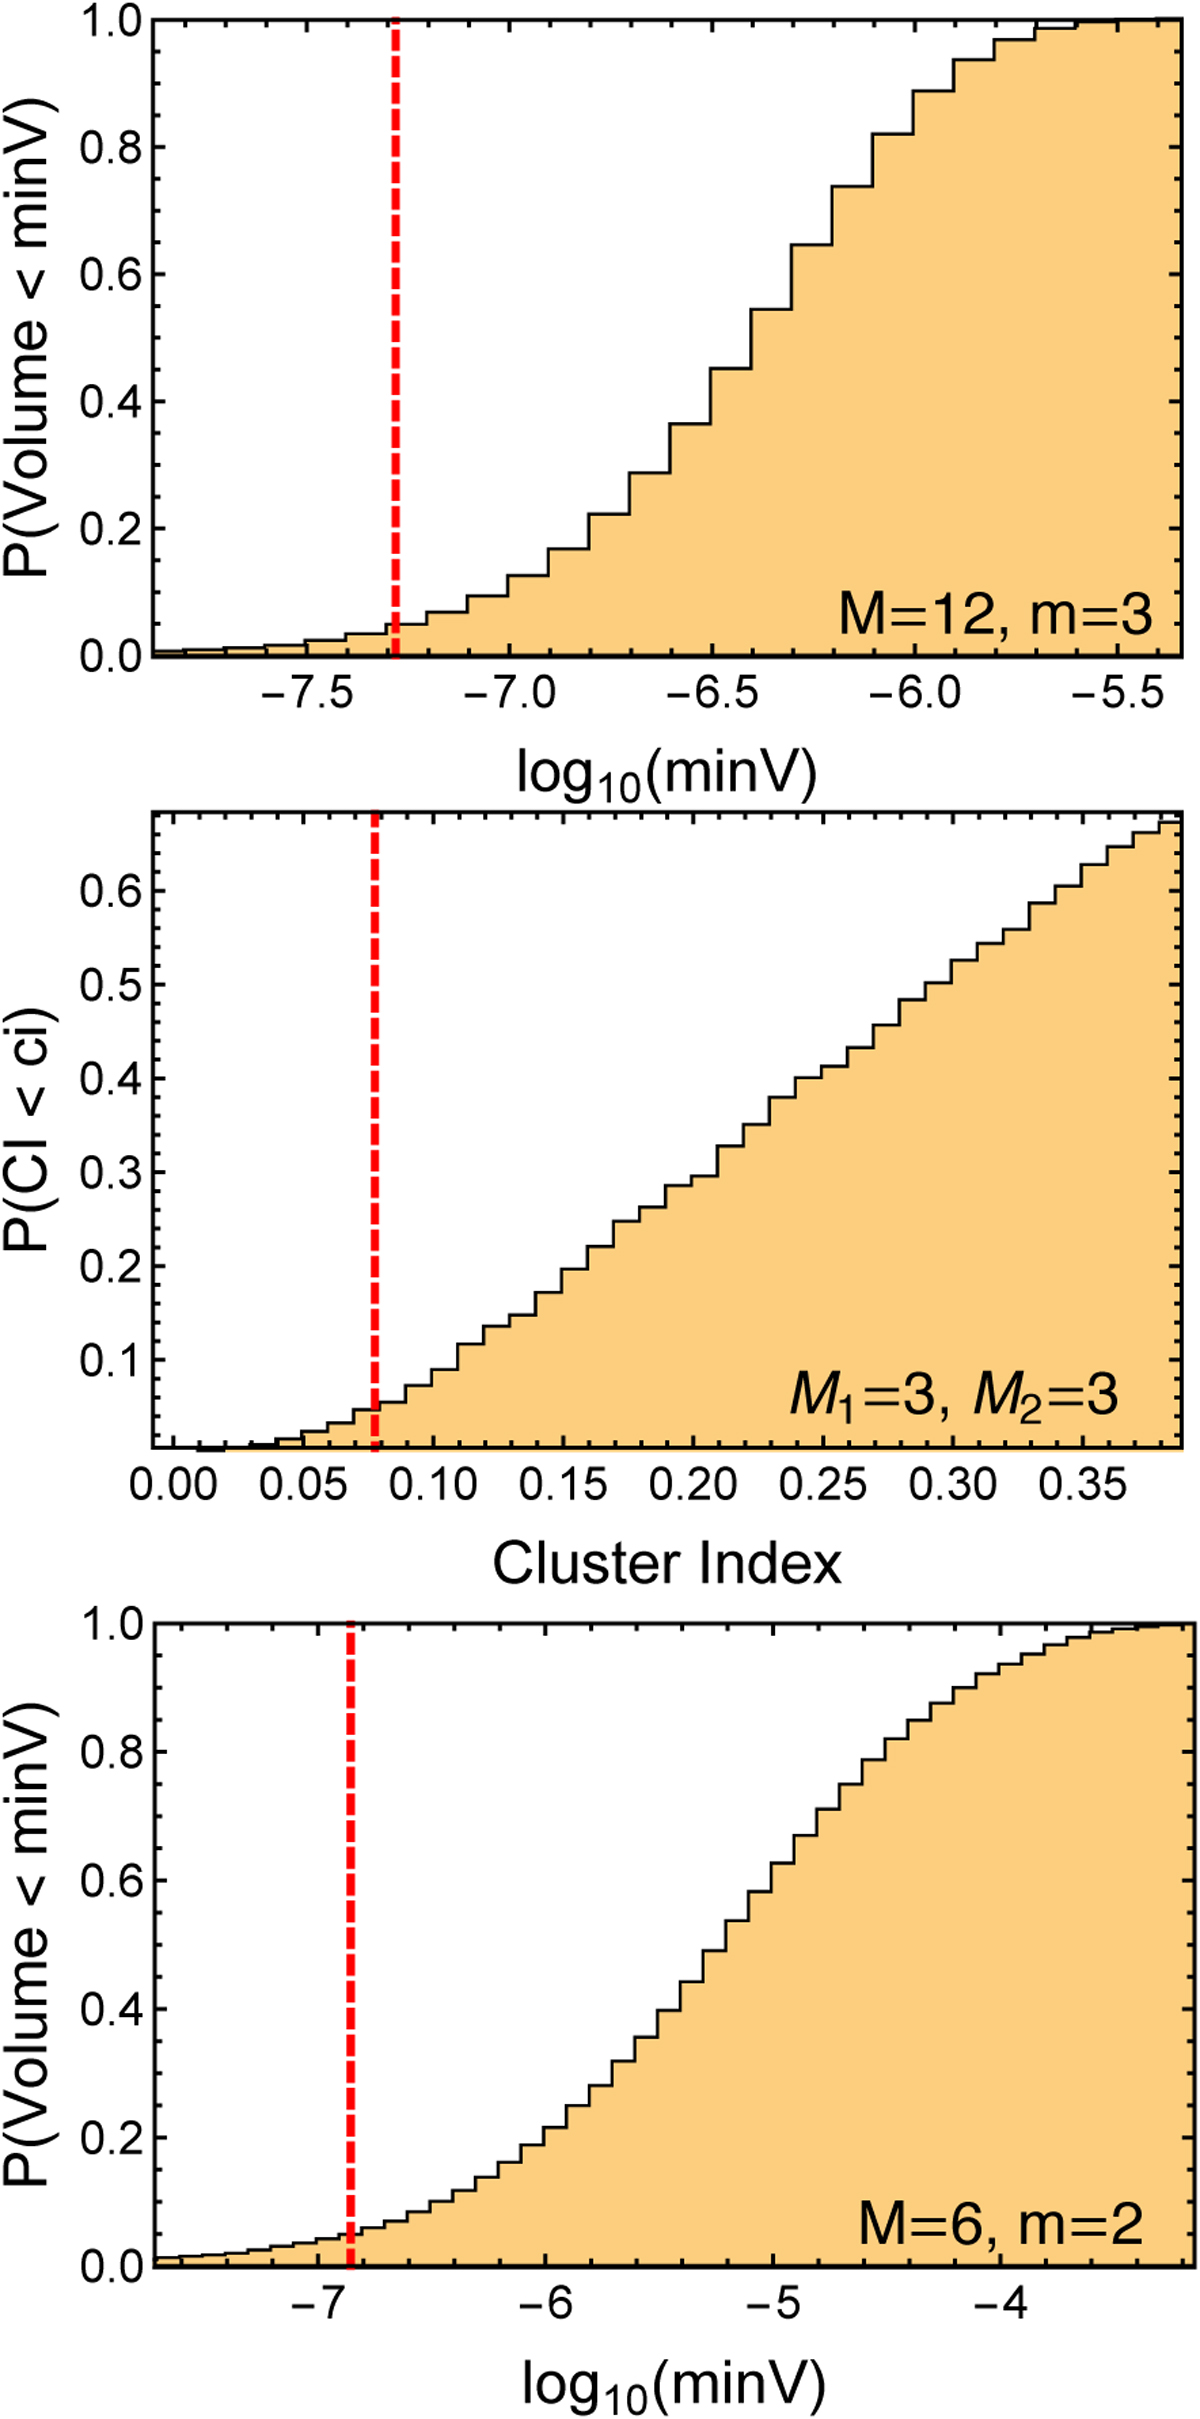
Statistical tests for candidate MT clusters. From top to bottom: MES volume distribution versus the test statistic value (red line) for the 2018 EC4 cluster; CI distribution versus the test statistic value for the 2009 SE cluster; and MES volume distribution versus the test statistic value for the 2009 SE – 2016 AA165 pair.
Current usage metrics show cumulative count of Article Views (full-text article views including HTML views, PDF and ePub downloads, according to the available data) and Abstracts Views on Vision4Press platform.
Data correspond to usage on the plateform after 2015. The current usage metrics is available 48-96 hours after online publication and is updated daily on week days.
Initial download of the metrics may take a while.