Open Access
Fig. 4
Download original image
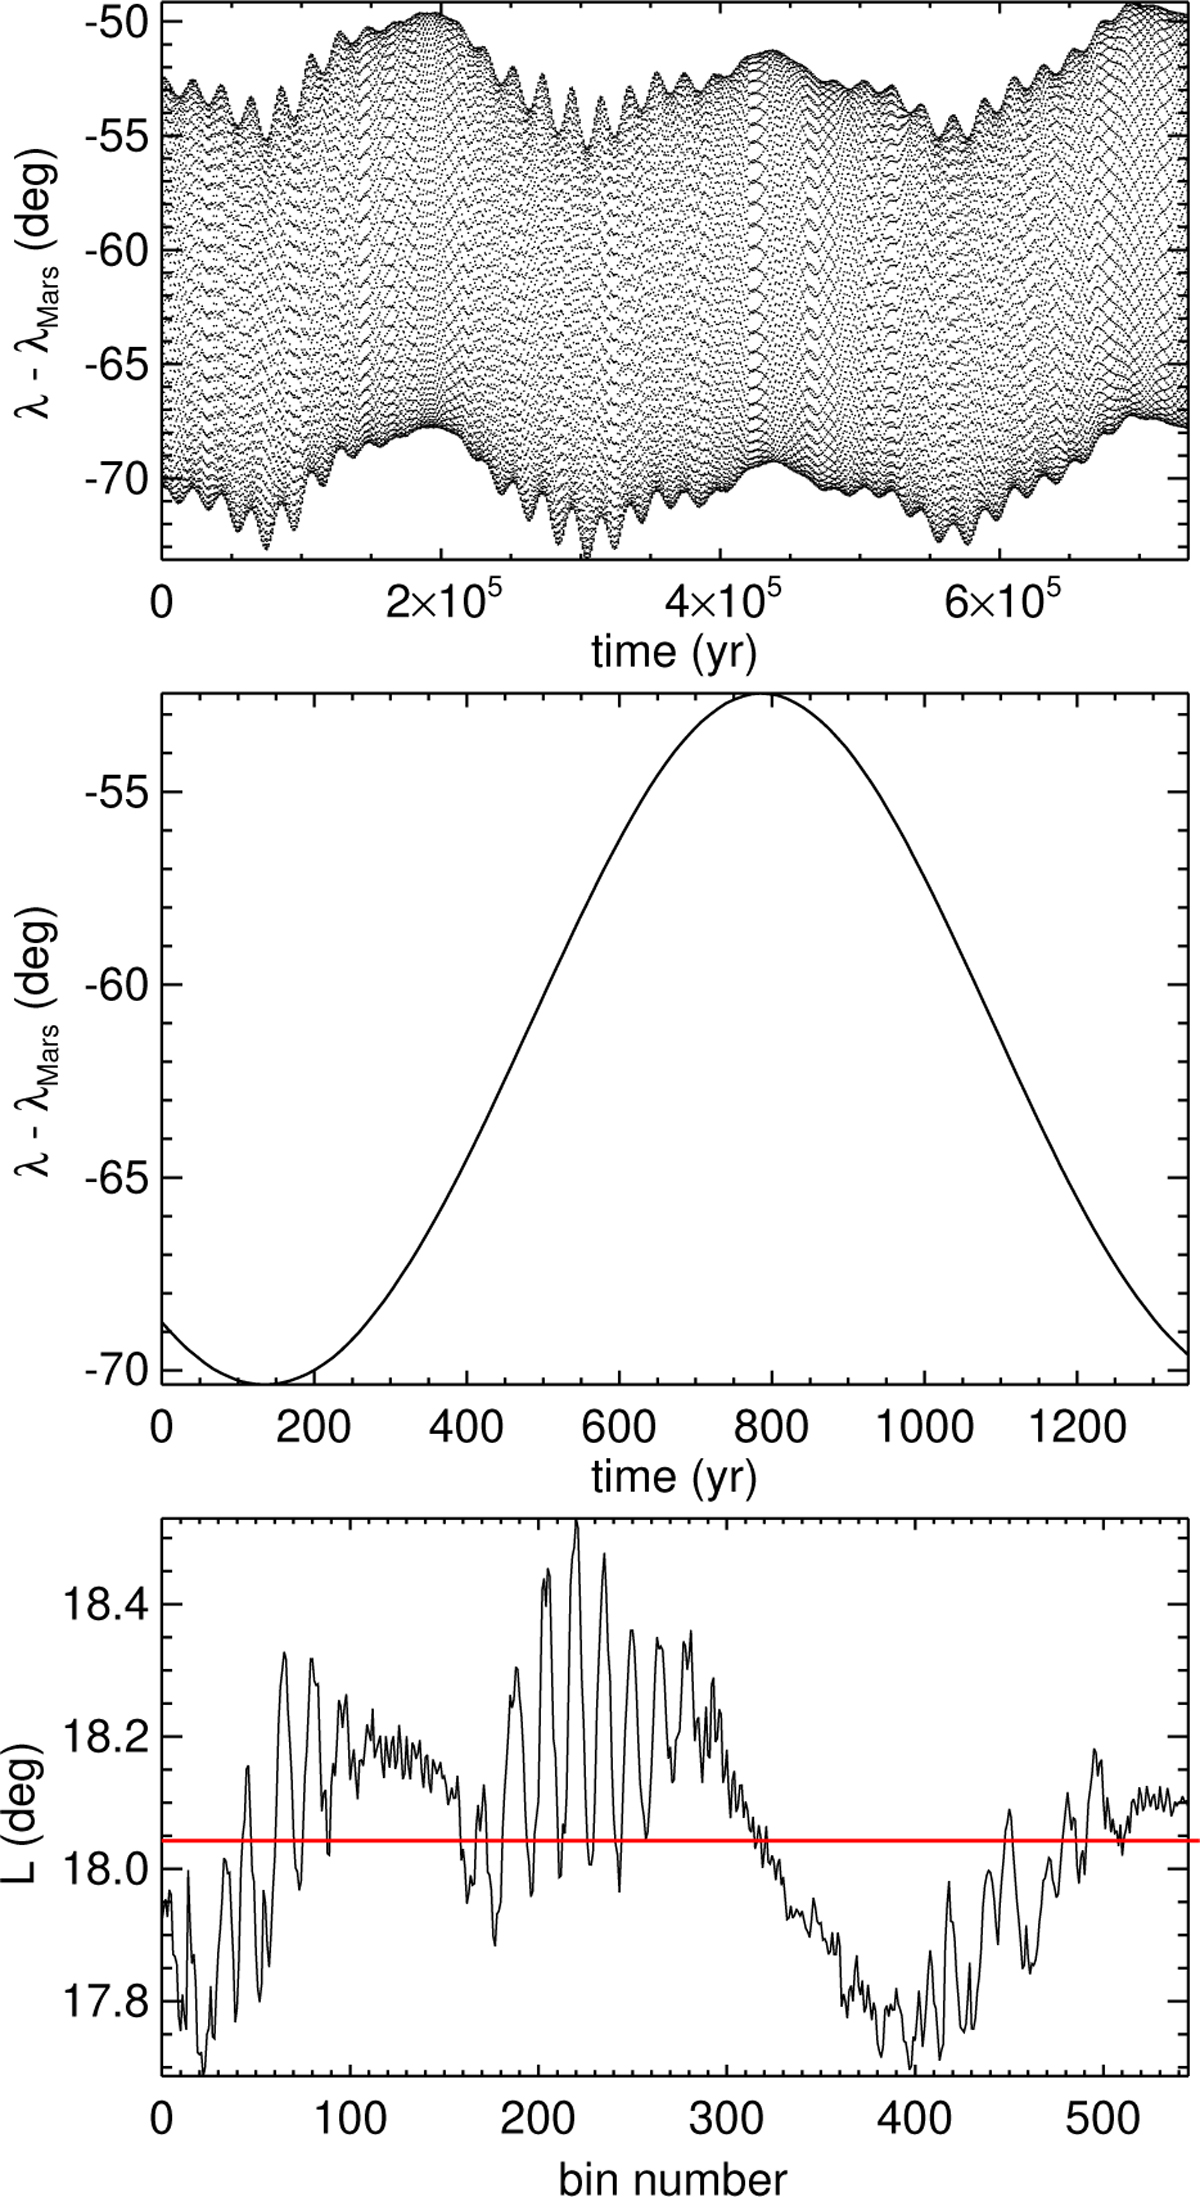
Example of libration width estimation for MT 2011 SC191 from the numerical simulations. Top: evolution of the critical angle lr. Middle: variation of lr over one boxcar width of 120 samples or ∼ 1350 yr. Bottom: variation of the L estimate over all boxcar windows with the average value (red dashed line) reported in Table 1.
Current usage metrics show cumulative count of Article Views (full-text article views including HTML views, PDF and ePub downloads, according to the available data) and Abstracts Views on Vision4Press platform.
Data correspond to usage on the plateform after 2015. The current usage metrics is available 48-96 hours after online publication and is updated daily on week days.
Initial download of the metrics may take a while.