Open Access
Fig. 1
Download original image
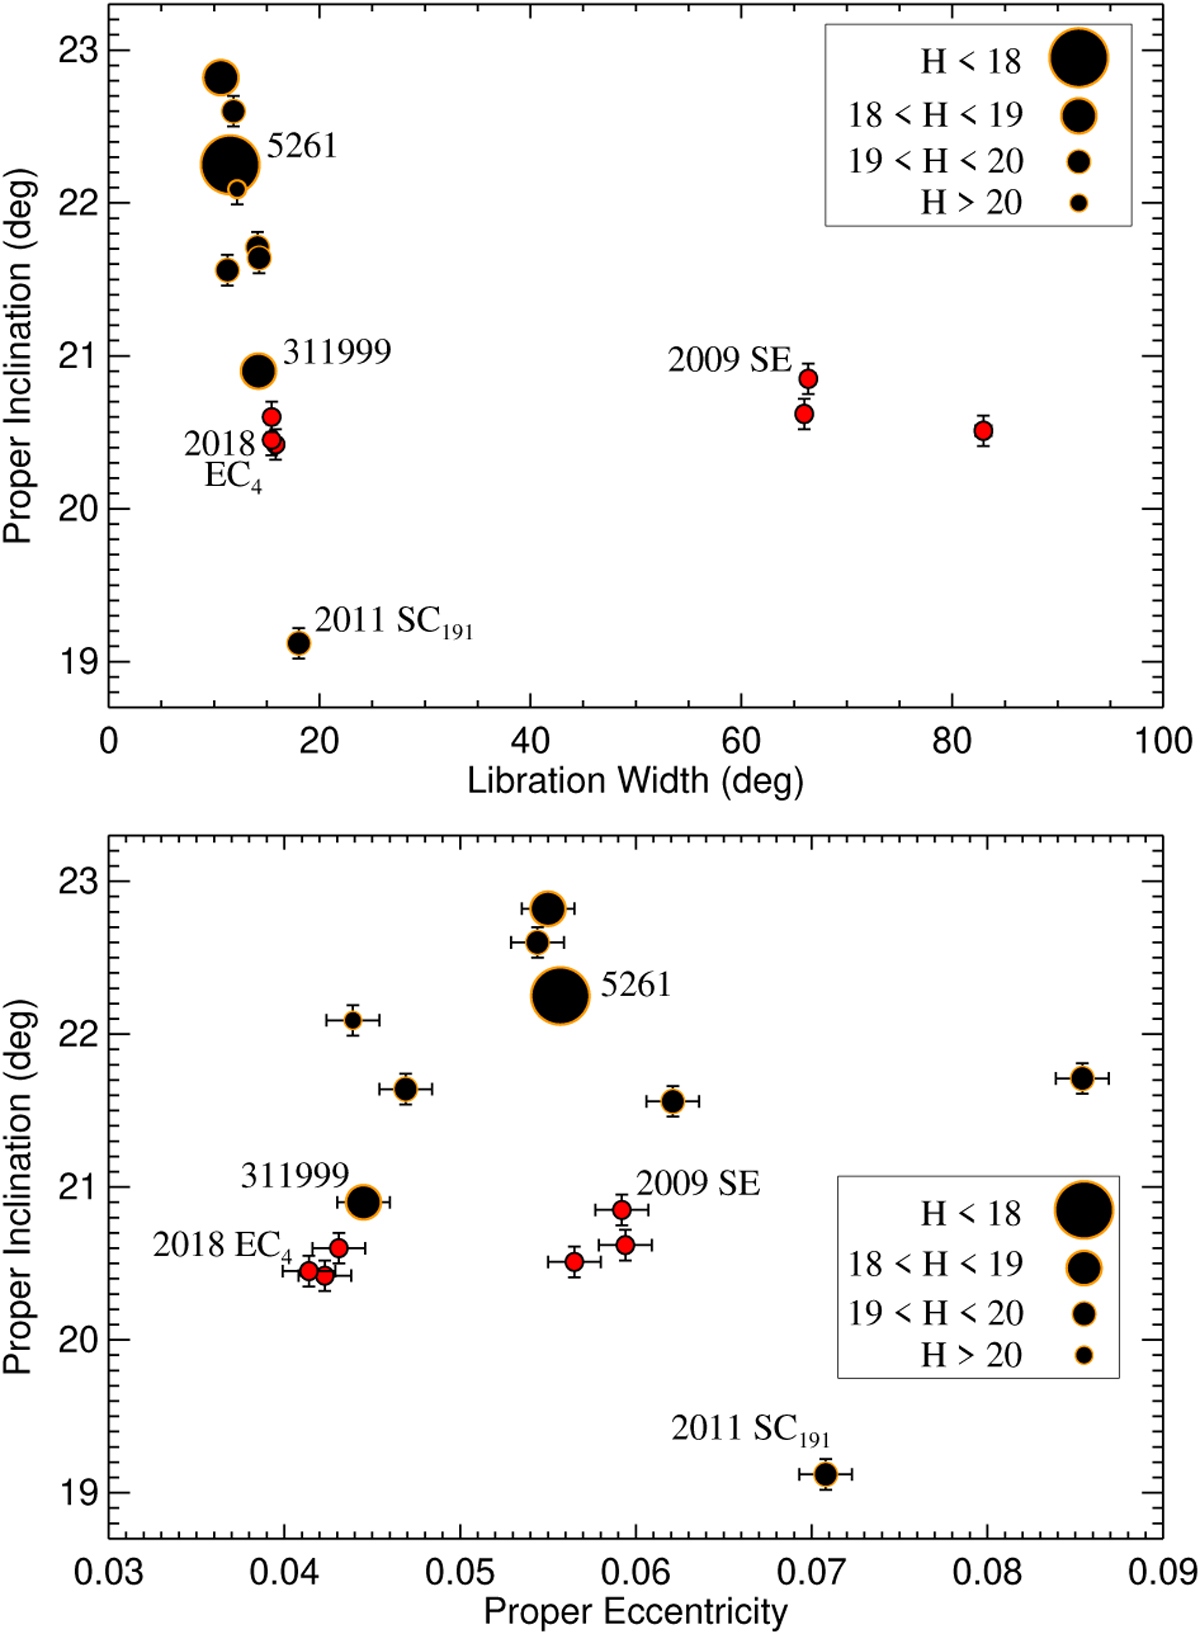
Distribution of L5 MTs in libration width (L) vs. inclination (IP) space (top) and eccentricity eP vs. inclination IP (bottom). Red points correspond to new asteroid clusters identified in this work. Plotted errors correspond to 2σ formal uncertainties and are smaller than the symbol size for the libration width L.
Current usage metrics show cumulative count of Article Views (full-text article views including HTML views, PDF and ePub downloads, according to the available data) and Abstracts Views on Vision4Press platform.
Data correspond to usage on the plateform after 2015. The current usage metrics is available 48-96 hours after online publication and is updated daily on week days.
Initial download of the metrics may take a while.