Open Access
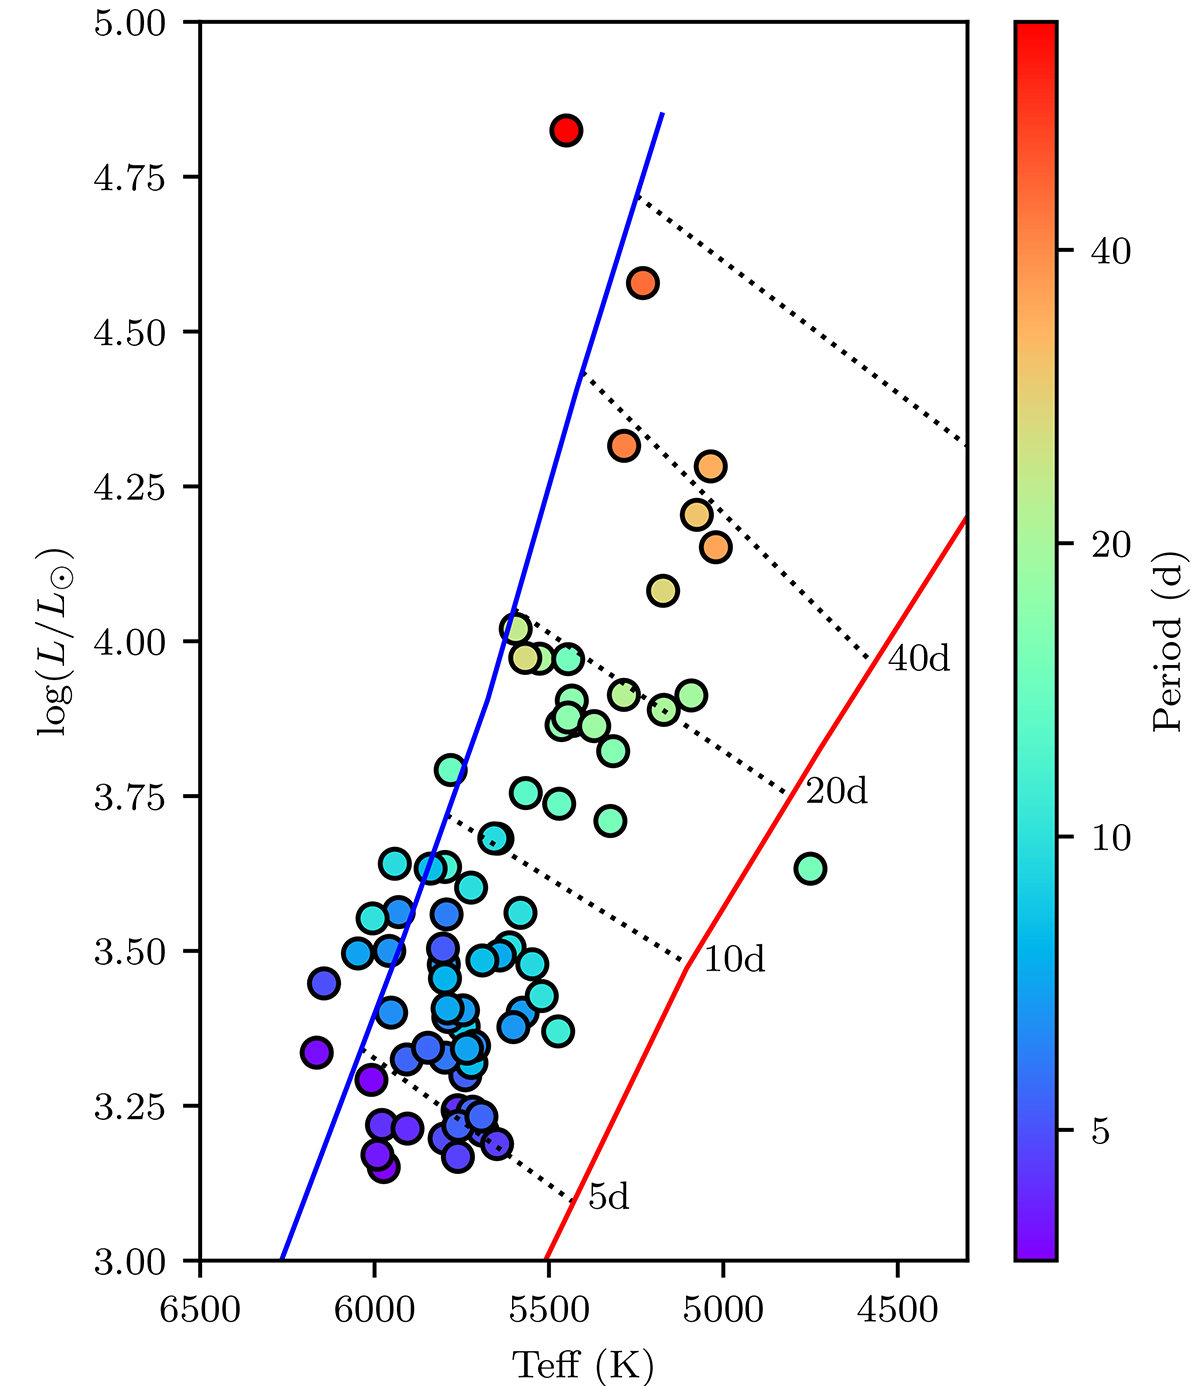
Fig. 7.
Download original image
Distribution in the instability strip of the 75 stars in the gold sample. The edges of the instability strip and the predicted periods are plotted according to Anderson (2016), for the first crossing, with a rotation of ωini = 0.5 and a solar metallicity of Z = 0.014 for comparison.
Current usage metrics show cumulative count of Article Views (full-text article views including HTML views, PDF and ePub downloads, according to the available data) and Abstracts Views on Vision4Press platform.
Data correspond to usage on the plateform after 2015. The current usage metrics is available 48-96 hours after online publication and is updated daily on week days.
Initial download of the metrics may take a while.