Open Access
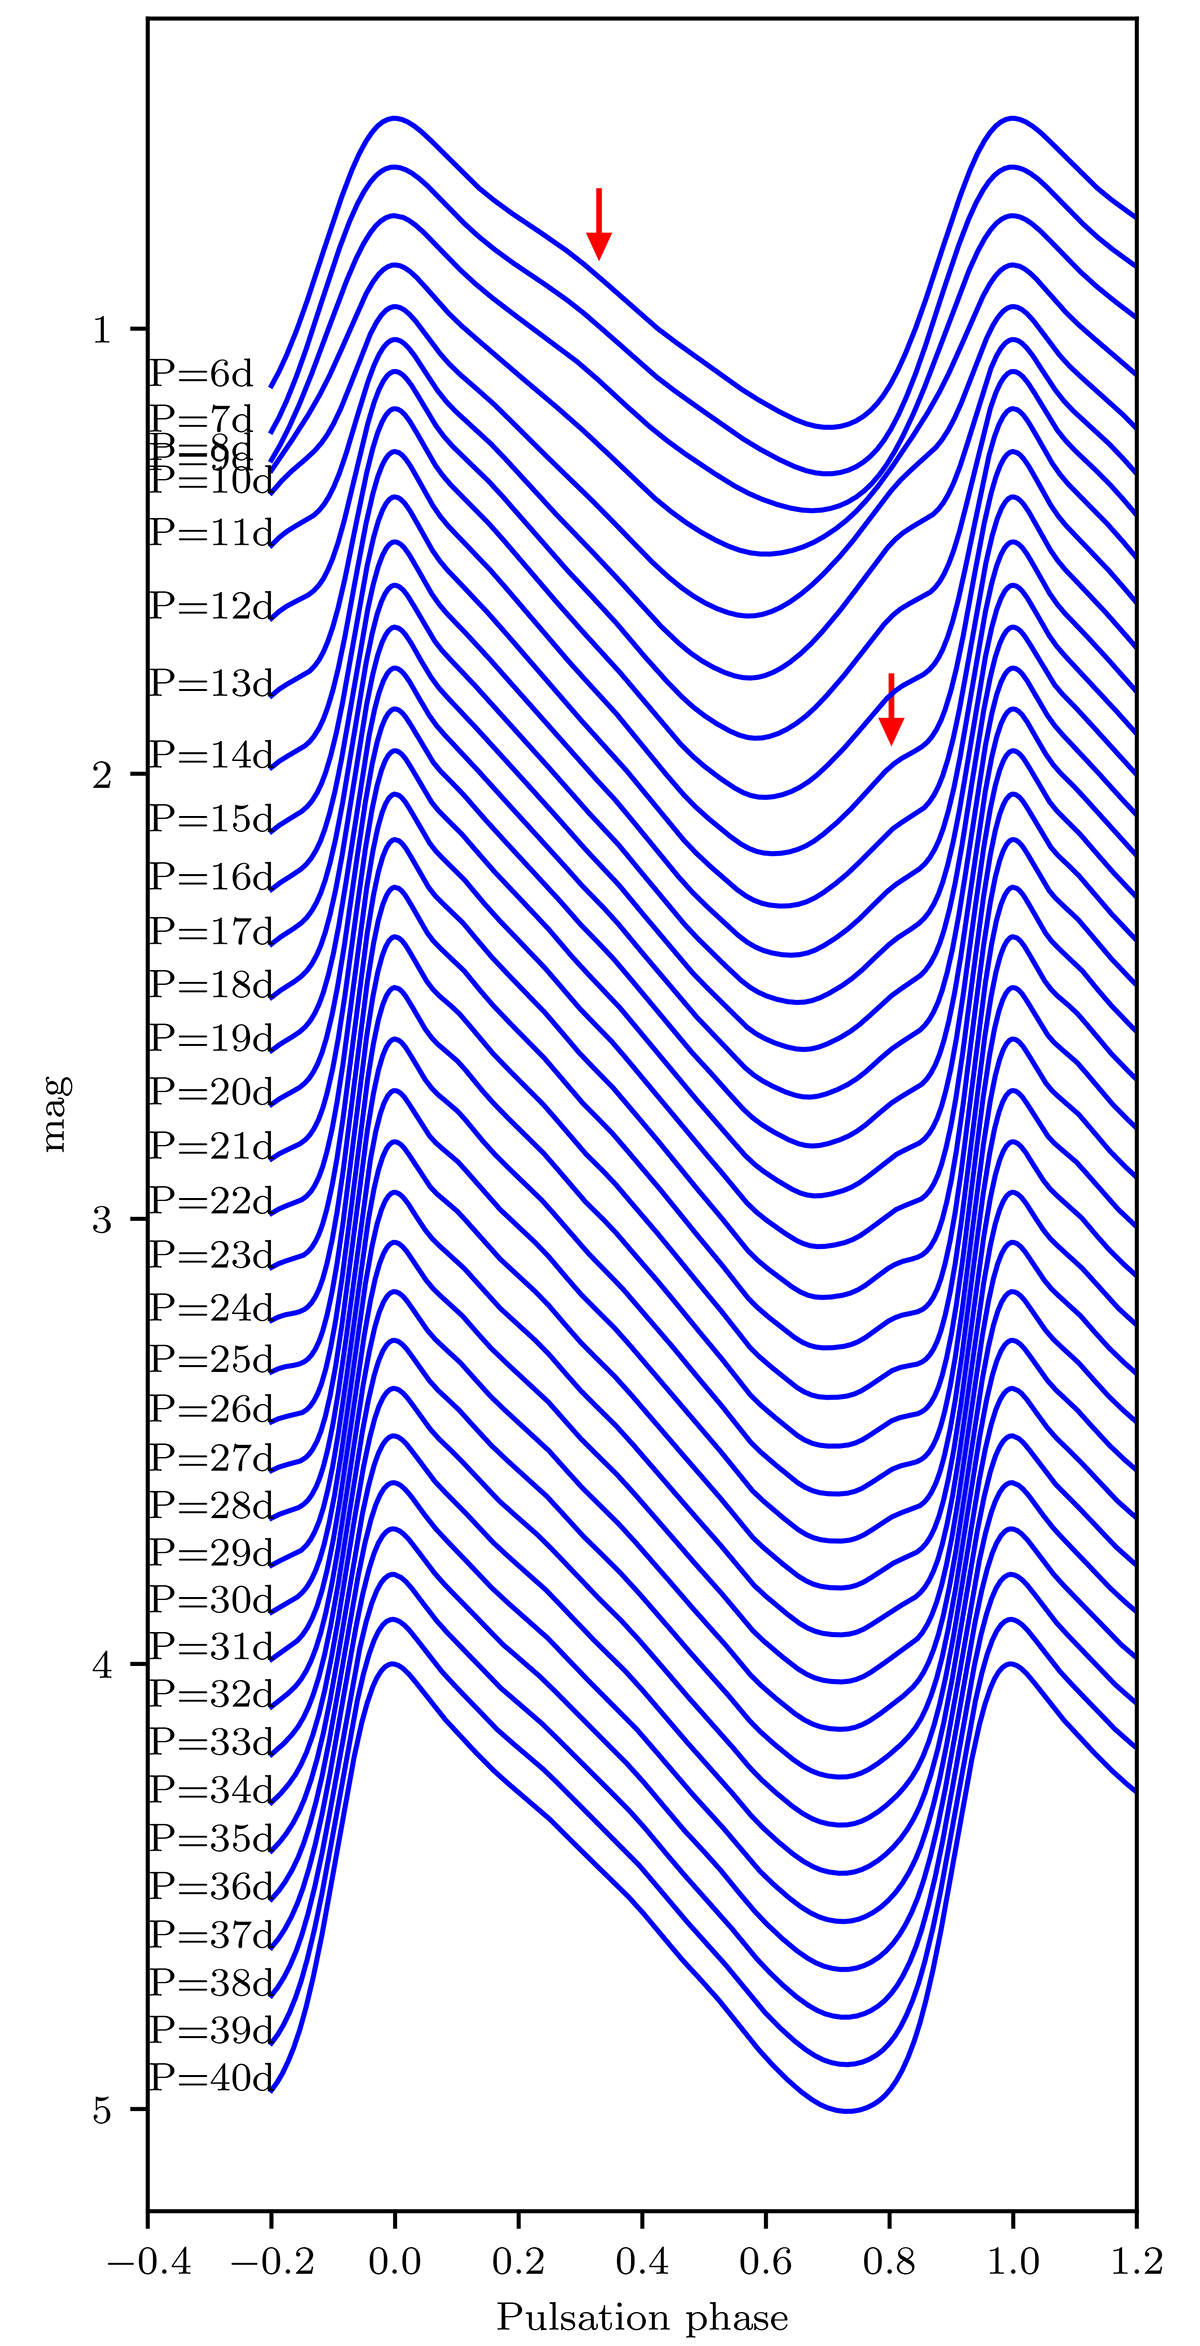
Fig. 11.
Download original image
Evolution of the shape of the LC with the period in the Johnson V band for periods from 6 to 40 days as predicted by our templates. The red arrow shows the secondary bump from the Hertzsprung progression.
Current usage metrics show cumulative count of Article Views (full-text article views including HTML views, PDF and ePub downloads, according to the available data) and Abstracts Views on Vision4Press platform.
Data correspond to usage on the plateform after 2015. The current usage metrics is available 48-96 hours after online publication and is updated daily on week days.
Initial download of the metrics may take a while.