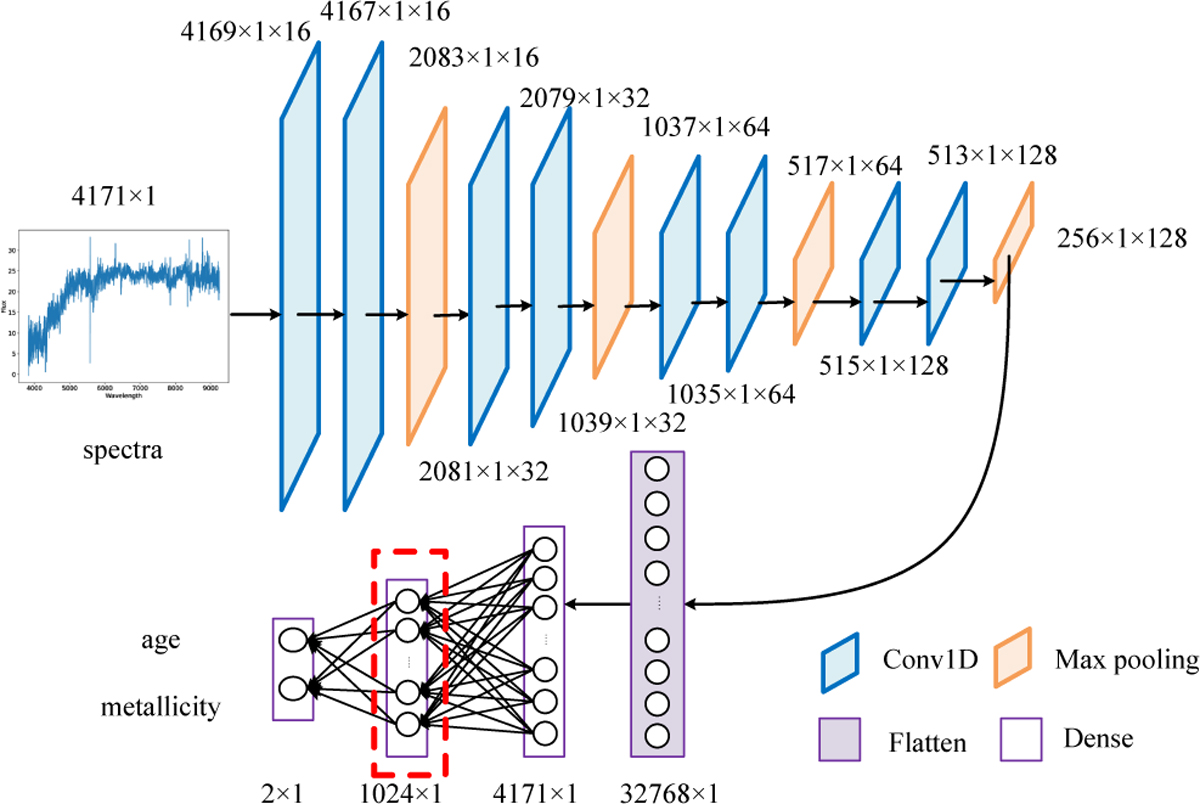
Fig. 5
Download original image
Architecture of the spectral feature extraction model (ℳ1). The shape of each layer is represented as a × b × c or a × b, where a × b represents the feature map dimensions and c is the number of convolutional filters. The red dashed box represents the final fully connected layer, whose output serves as the label for training the next model, ℳ2.
Current usage metrics show cumulative count of Article Views (full-text article views including HTML views, PDF and ePub downloads, according to the available data) and Abstracts Views on Vision4Press platform.
Data correspond to usage on the plateform after 2015. The current usage metrics is available 48-96 hours after online publication and is updated daily on week days.
Initial download of the metrics may take a while.