Fig. 13
Download original image
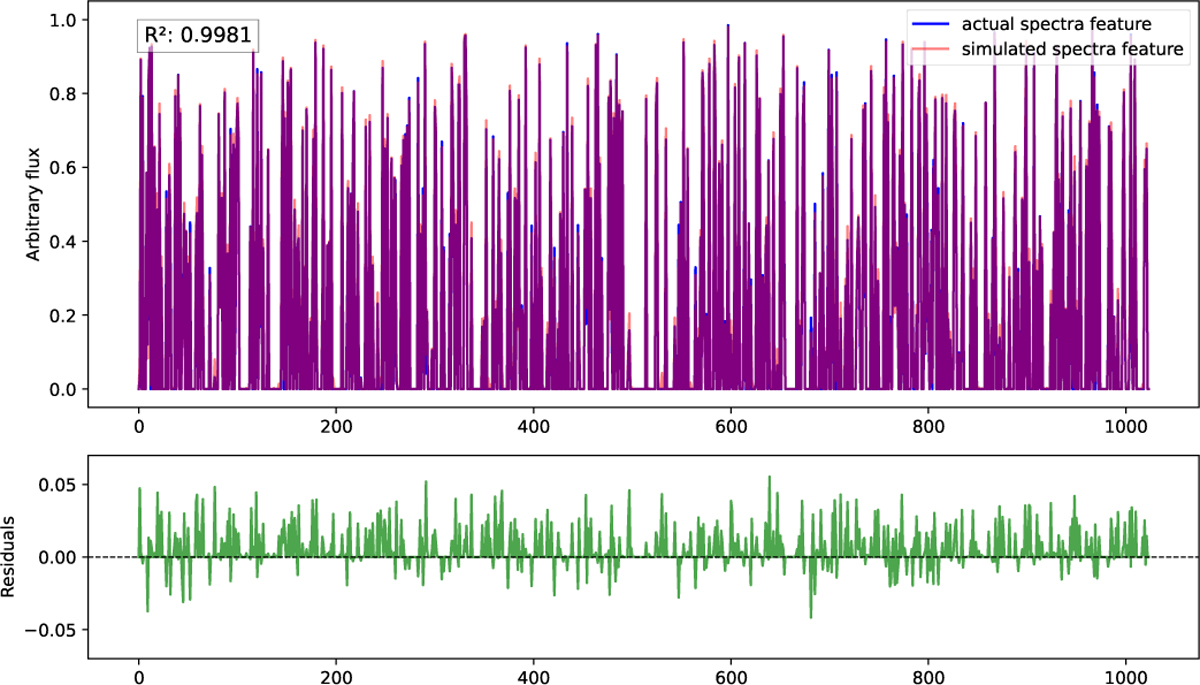
Example of spectral features generated by model ℳ2 and true spectral features extracted from observed galaxy spectra. The upper panel shows the normalised spectral features ([0,1]), with red and blue curves representing the simulated and true features, respectively. The lower panel shows the residuals between the simulated and true spectral features.
Current usage metrics show cumulative count of Article Views (full-text article views including HTML views, PDF and ePub downloads, according to the available data) and Abstracts Views on Vision4Press platform.
Data correspond to usage on the plateform after 2015. The current usage metrics is available 48-96 hours after online publication and is updated daily on week days.
Initial download of the metrics may take a while.