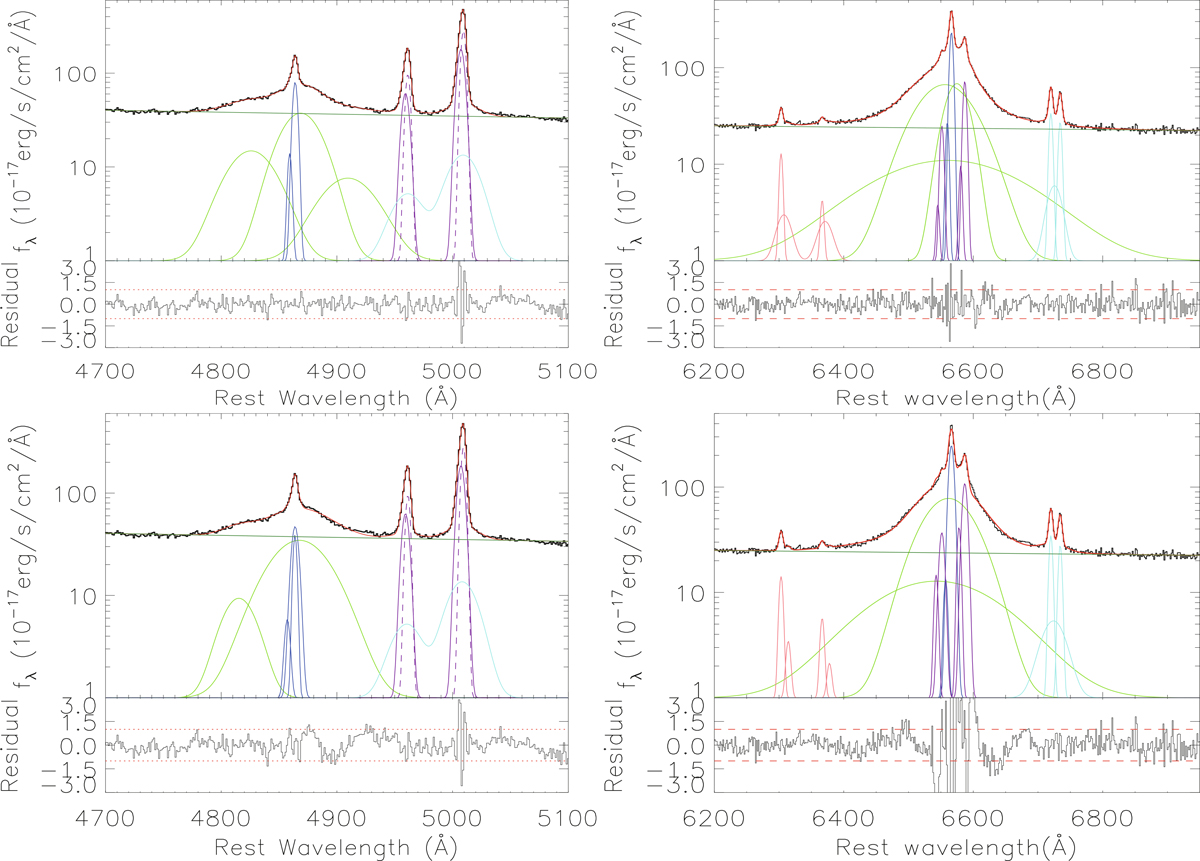
Fig. 9.
Download original image
Top panels: Fitting results and corresponding residuals for the emission lines around Hβ and Hα, respectively, considering three broad Gaussian components for broad Balmer lines. In the top left panel, the solid black line represents the observed SDSS spectrum, the solid red line indicates the best-fitting results, the green and blue lines show the broad and narrow Hβ components, and the solid cyan and purple lines represent the core and extended components of the [O III] doublet. In the top right panel, the solid black line represents the observed SDSS spectrum, the solid red line represents the best-fitting results, the solid green line illustrates the broad Gaussian components of Hα, the solid blue line represents the narrow Gaussian components in Hα, the solid purple line shows the core and extended components of the [N II] doublet, the solid cyan line represents the core and extended components in the [S II] doublet, and the solid pink line indicates the core and extended components in the [O I] doublet. In each top panel, the dashed green line represents the determined power-law continuum emissions. For each residual, the dashed horizontal red lines show residuals = ±1. In order to show clear features of the determined emission components, the plots are shown with y-axis in logarithmic. Similarly to the results presented in the top panels, bottom panels show the fitting results and the corresponding residuals for the emission lines around Hβ and Hα, respectively, considering two broad Gaussian components for broad Balmer lines.
Current usage metrics show cumulative count of Article Views (full-text article views including HTML views, PDF and ePub downloads, according to the available data) and Abstracts Views on Vision4Press platform.
Data correspond to usage on the plateform after 2015. The current usage metrics is available 48-96 hours after online publication and is updated daily on week days.
Initial download of the metrics may take a while.