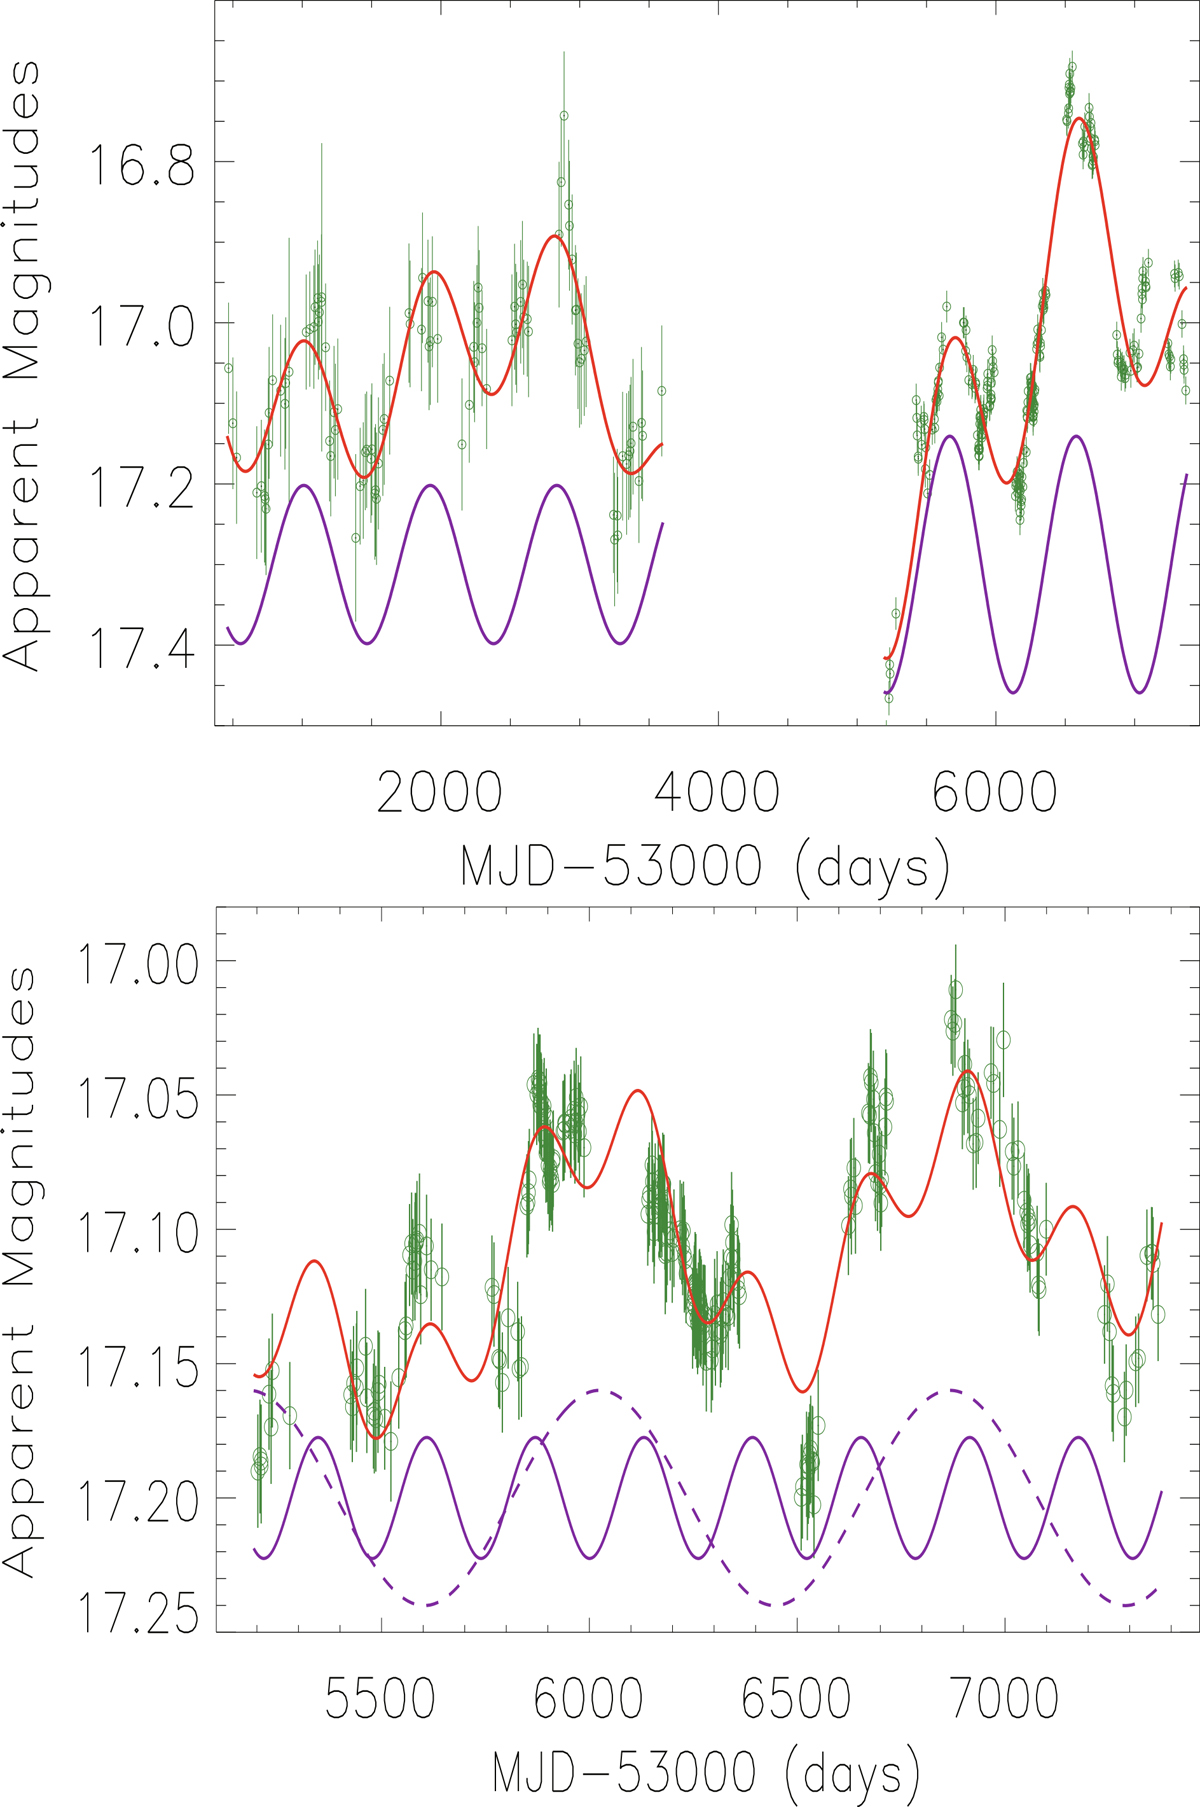
Fig. 7.
Download original image
Top panel: Example of probable misdetected QPOs in the first set of simulated light curves by the CAR process. Solid dark green circles plus error bars show the simulated light curve, solid lines in red show the best-fitting result by Equation (1), with χ2/d.o.f. = 6. The solid lines in purple show the sinusoidal component with a period of 910 days. Bottom panel: One of the probable misdetected QPOs in the second set of simulated light curves. Solid dark green circles plus error bars show the simulated light curve, and the solid line in red shows the best-fitting result by Equation (5), with χ2/d.o.f. = 1.13. The solid and dashed lines in purple show the sinusoidal components with periodicity of 263 days and 851 days, respectively.
Current usage metrics show cumulative count of Article Views (full-text article views including HTML views, PDF and ePub downloads, according to the available data) and Abstracts Views on Vision4Press platform.
Data correspond to usage on the plateform after 2015. The current usage metrics is available 48-96 hours after online publication and is updated daily on week days.
Initial download of the metrics may take a while.