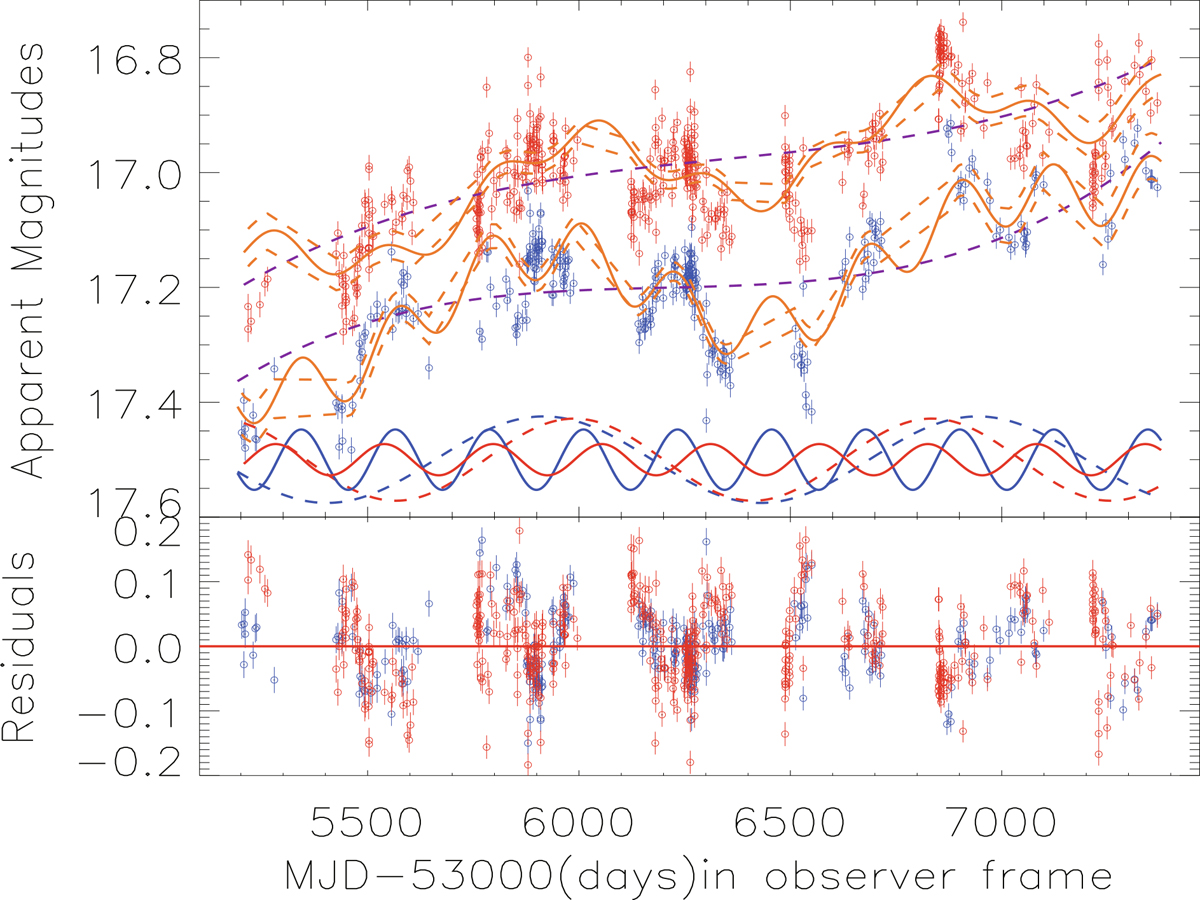
Fig. 6.
Download original image
Best-fitting results (top panel) and corresponding residuals (bottom panel) to the ZTF g/r-band light curves by two sinusoidal components. Top panel: Circles plus error bars in blue and in red show the ZTF g-band and r-band light curves, solid orange lines represent the best-fitting results, dashed orange lines indicate the 5σ (99.99994%) confidence bands, and dashed purple lines show the polynomial components. The dashed blue and solid blue lines show the sinusoidal components with periods of 1024±12 days and 222±1 days in the ZTF g-band light curve, and the dashed and solid lines in red represent the sinusoidal components with periods of 886±6 days and 257±1 days in the ZTF r-band light curve.
Current usage metrics show cumulative count of Article Views (full-text article views including HTML views, PDF and ePub downloads, according to the available data) and Abstracts Views on Vision4Press platform.
Data correspond to usage on the plateform after 2015. The current usage metrics is available 48-96 hours after online publication and is updated daily on week days.
Initial download of the metrics may take a while.