Open Access
Fig. 5.
Download original image
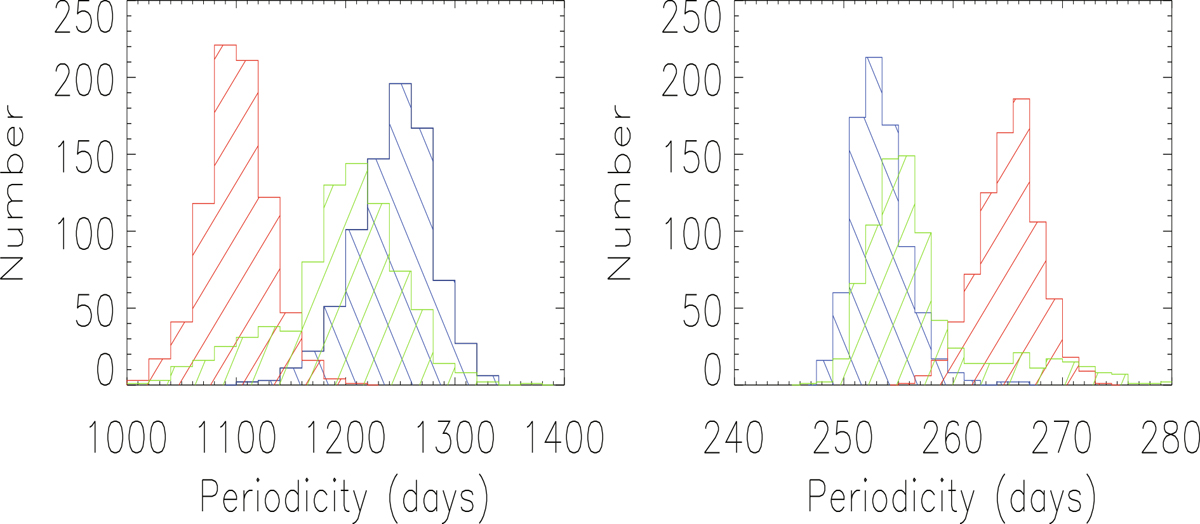
Both panels: Distributions of WWZ-determined periodicities around 1000 days and 200 days, as determined by the bootstrap method. The green, blue, and red histograms show the results for the CSS V-band, the ZTF g-band and r-band light curves, respectively.
Current usage metrics show cumulative count of Article Views (full-text article views including HTML views, PDF and ePub downloads, according to the available data) and Abstracts Views on Vision4Press platform.
Data correspond to usage on the plateform after 2015. The current usage metrics is available 48-96 hours after online publication and is updated daily on week days.
Initial download of the metrics may take a while.