Open Access
Fig. 3.
Download original image
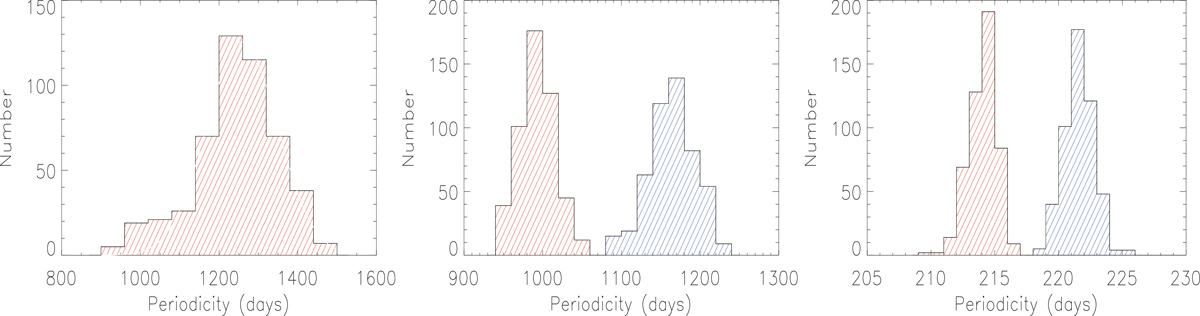
Periodicity distributions through the bootstrap method. Left panel: Results for the CSS V-band light curve. Middle panel and right panel: Periodicities for the ZTF g-band (blue histogram) around 1165 days and 221 days, as well as for the ZTF r band (red histogram) around 990 days and 215 days.
Current usage metrics show cumulative count of Article Views (full-text article views including HTML views, PDF and ePub downloads, according to the available data) and Abstracts Views on Vision4Press platform.
Data correspond to usage on the plateform after 2015. The current usage metrics is available 48-96 hours after online publication and is updated daily on week days.
Initial download of the metrics may take a while.