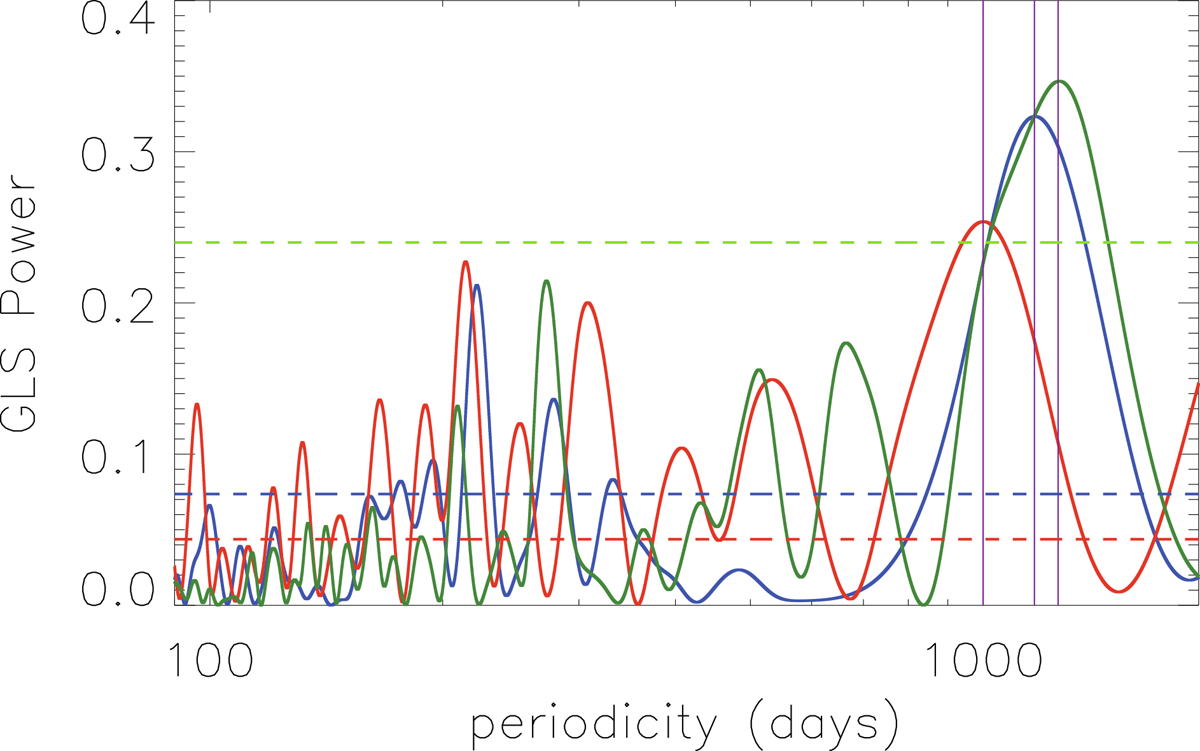
Fig. 2.
Download original image
Properties of the GLS periodogram. Solid lines in red, blue, and green show the corresponding results from the ZTF r-band, g-band, and CSS V-band light curves, respectively. The dashed horizontal lines in red, blue, and green indicate the corresponding 5σ confidence levels (FAP = 1–99.99994%) for the results from the ZTF r-band, g-band, and CSS V-band light curves, respectively.
Current usage metrics show cumulative count of Article Views (full-text article views including HTML views, PDF and ePub downloads, according to the available data) and Abstracts Views on Vision4Press platform.
Data correspond to usage on the plateform after 2015. The current usage metrics is available 48-96 hours after online publication and is updated daily on week days.
Initial download of the metrics may take a while.