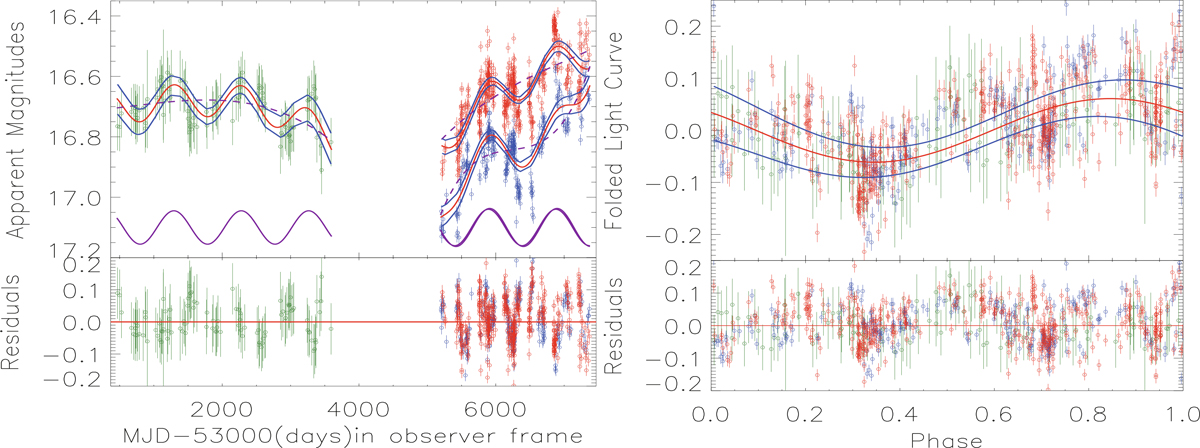
Fig. 1.
Download original image
Top left panel: Light curves from the CSS (solid circles plus error bars in green) and from the ZTF in the g band (minus 0.35 mag) (open circles plus error bars in blue) and r band (minus 0.35 mag) (open circles plus error bars in red), alongside the best-fitting results (solid lines in red) from a sinusoidal function plus a fourth-degree polynomial component. The solid purple lines represent the component described by the sinusoidal function (plus 17.5 mag), while the dashed purple lines indicate the component modeled by the polynomial function. The solid blue lines indicate the corresponding 5σ confidence bands to the best-fitting results through the F-test technique. Top right panel: Phase-folded light curves based on the determined periodicity 985 days (with the polynomial trends subtracted; green for CSS data, blue for ZTF g band, and red for ZTF r band) along with the best sinusoidal fit (solid line in red). The same as the top left panel for the solid blue lines. Bottom panels: Corresponding residuals (light curves minus the best-fitting results), with the solid red line denoting the residuals = 0.
Current usage metrics show cumulative count of Article Views (full-text article views including HTML views, PDF and ePub downloads, according to the available data) and Abstracts Views on Vision4Press platform.
Data correspond to usage on the plateform after 2015. The current usage metrics is available 48-96 hours after online publication and is updated daily on week days.
Initial download of the metrics may take a while.