Fig. 8.
Download original image
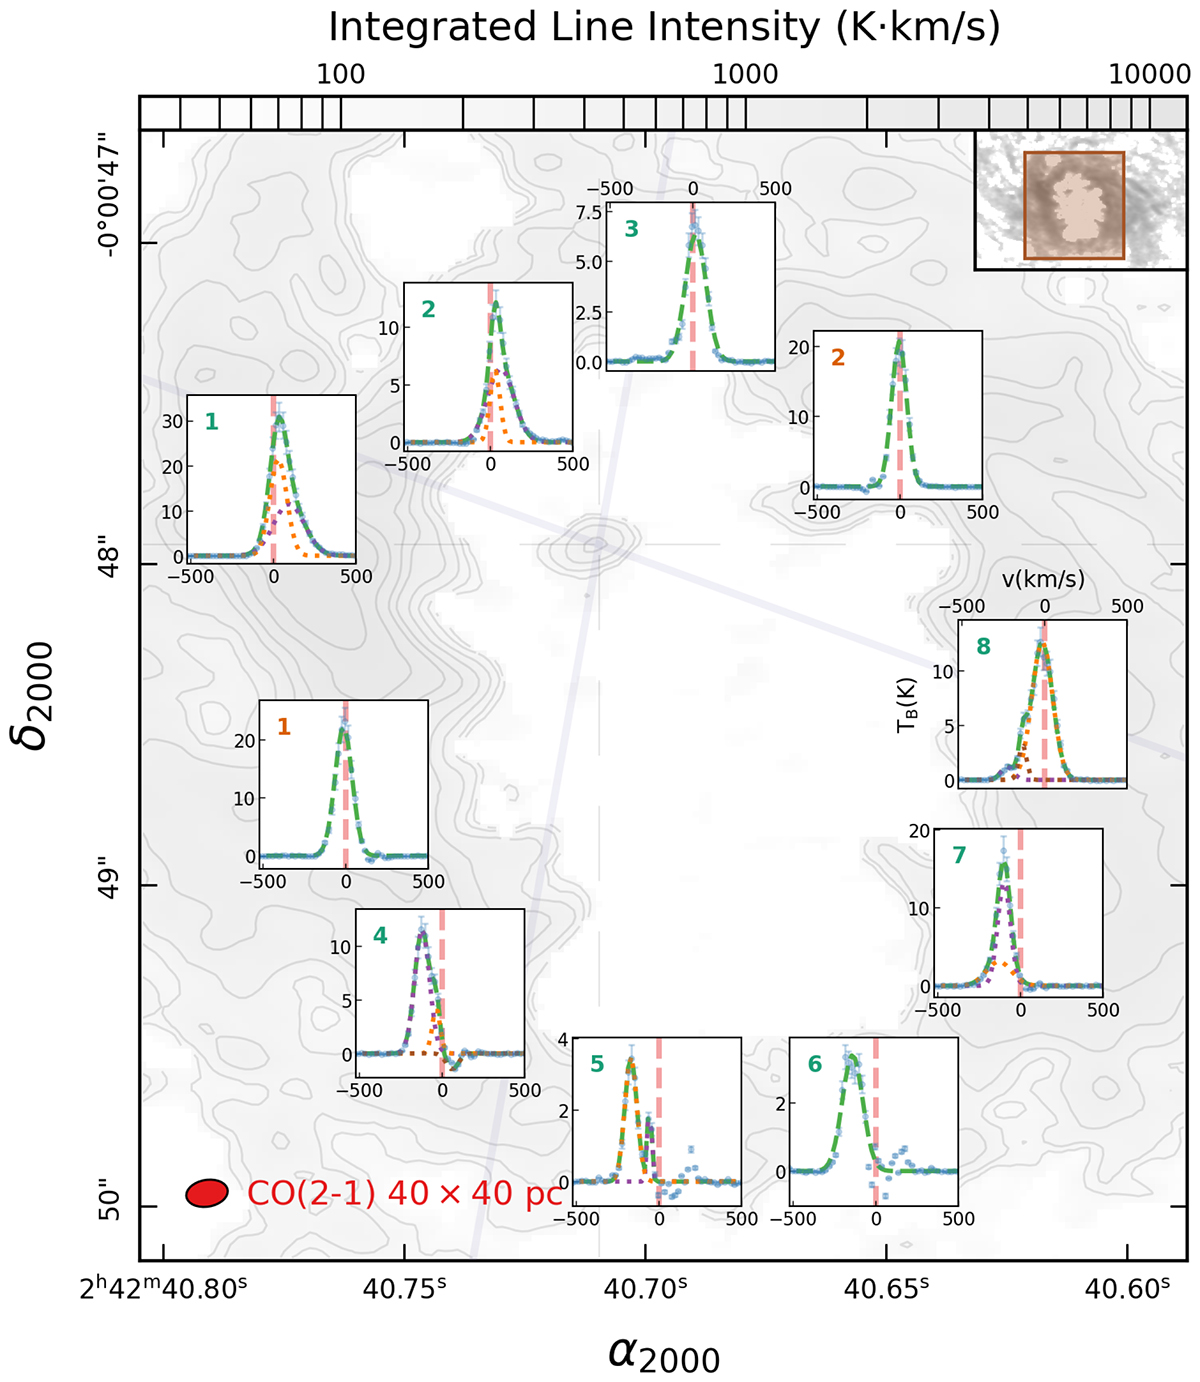
CO(2–1) transition line profiles of all regions defined based on the outflow occupying the exact locations on the background plot as assigned in the region definition in Sect. 3.2. Region numbers, including their colors, are indicated at the upper-left corner of each plot. They correspond to those appearing in the region codes in Table 2 and are defined in Sect. 3.2. The x-axis of all line profile plots indicates the radial velocity of the gas, v, in the unit of km s−1. The y-axes are for the amount of emission within each channel, TB, in the unit of K. The blue data points and error bars within each region are the observed averaged line profile overplotted by the optimal fit as a green dashed line. The mean velocity of the galaxy, vsys, is indicated by the vertical red dash line for each line profile plot. Suppose the averaged line profile within one region was fit with a weighted multi-component Gaussian. All weighted Gaussian components are also provided in the plot as dotted lines using different colors (purple and orange for the first two components and brown for the third component). The transition of the line, CO(2–1), is indicated at the lower left corner of the background plot, and all other symbols are the same in the background plot as those in Fig. 5.
Current usage metrics show cumulative count of Article Views (full-text article views including HTML views, PDF and ePub downloads, according to the available data) and Abstracts Views on Vision4Press platform.
Data correspond to usage on the plateform after 2015. The current usage metrics is available 48-96 hours after online publication and is updated daily on week days.
Initial download of the metrics may take a while.