Fig. 6.
Download original image
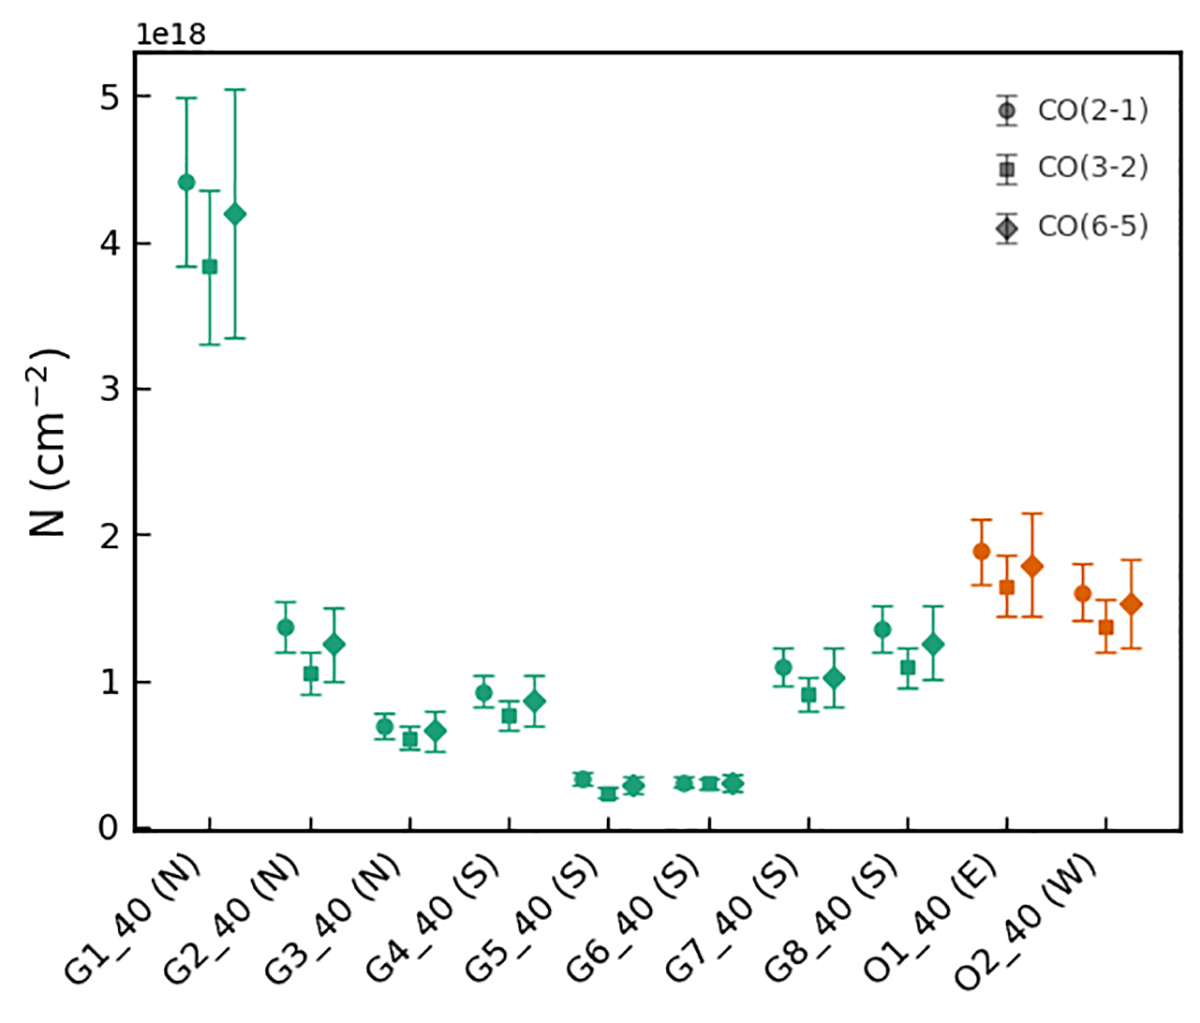
Total CO column densities (N) independently calculated from three CO transitions for all regions selected based on the outflow. The x-axis marks the region labels along with their locations around the CND (in brackets), while the y-axis indicates the total CO column densities in the unit of cm−2. The region code (along the x-axis) and color (the color of the data points) of each region match those in Table 2 and are defined in Sect. 3.2. The legend at the upper-right corner of the plot designates the symbols corresponding to the column densities calculated from three different CO transitions.
Current usage metrics show cumulative count of Article Views (full-text article views including HTML views, PDF and ePub downloads, according to the available data) and Abstracts Views on Vision4Press platform.
Data correspond to usage on the plateform after 2015. The current usage metrics is available 48-96 hours after online publication and is updated daily on week days.
Initial download of the metrics may take a while.