Fig. 5.
Download original image
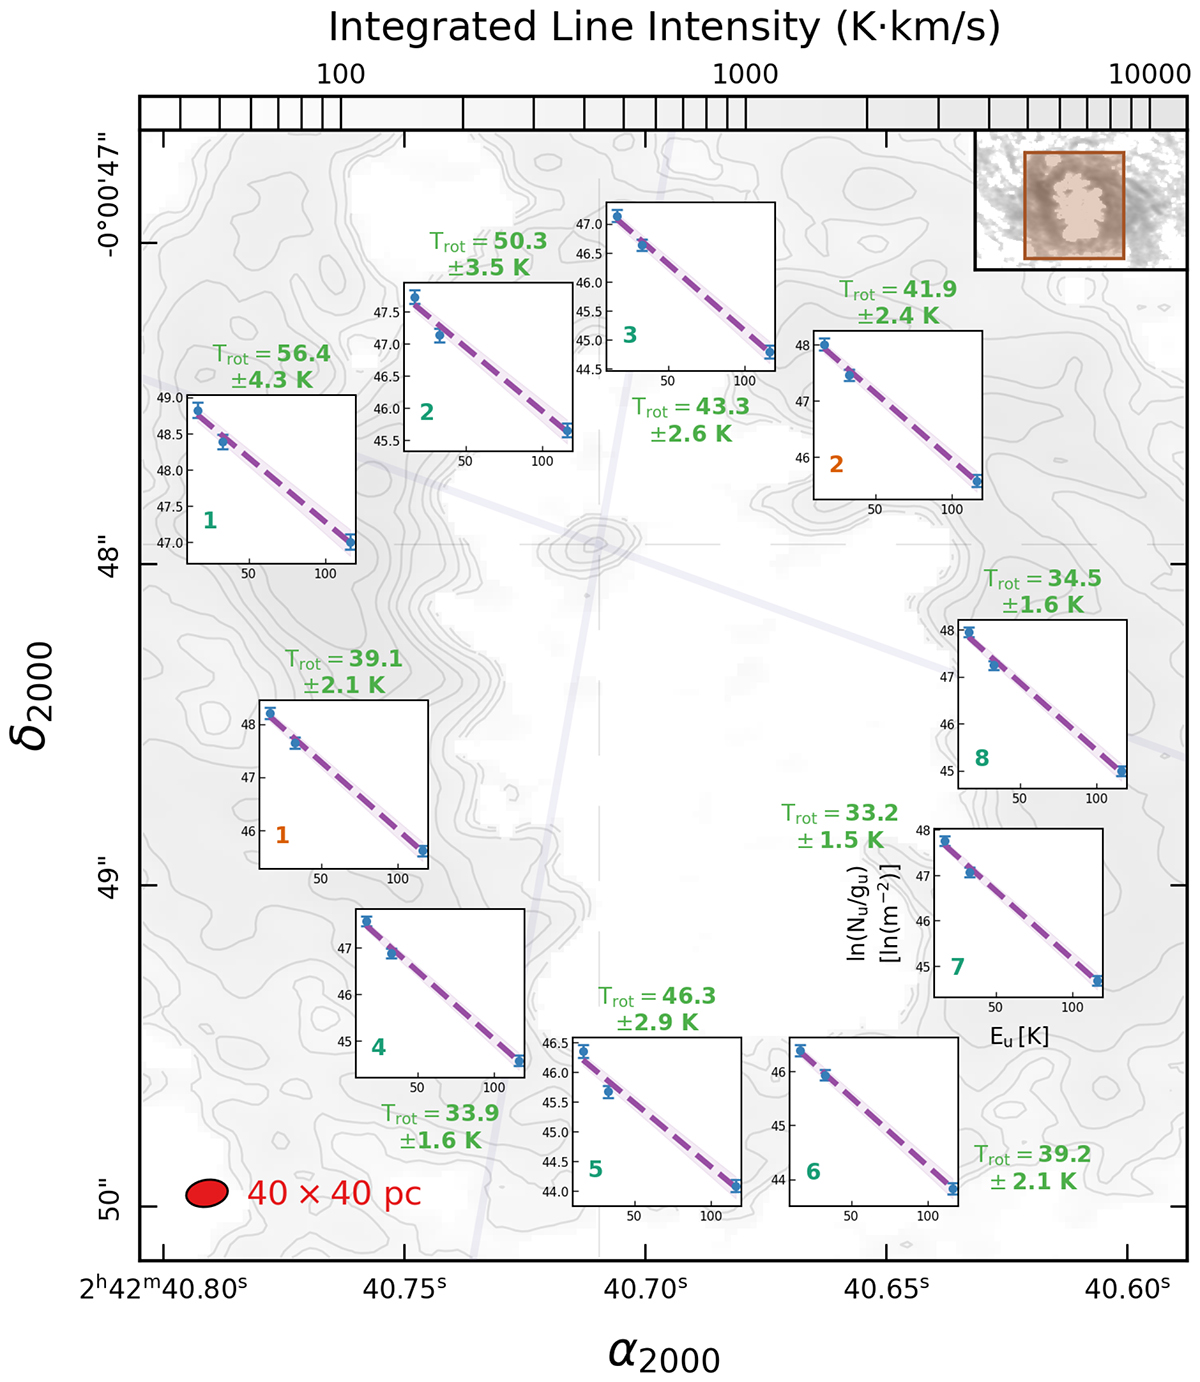
Rotational diagrams of all regions defined based on the outflow occupying the same locations on the background plot as assigned in the region definition in Sect. 3.2. Region numbers are listed in Table 2. The y-axis of the rotational diagrams is in the natural logarithmic scale (contrary to the “log10” scale used in some other literature), while the x-axis is in the linear scale, and their labels are showcased for region G6_40 (S). The blue data points with error bars within each plot are the weighted upper-level column densities from three CO transitions at their respective upper energy levels. The purple dashed line and the corresponding light purple shaded area are the fit based on the LTE condition and its uncertainty. The calculated rotational temperatures and their uncertainties are in green. The background plot is a cutout from Fig. 1, and the cutout region is indicated in brown in the inset plot at the upper-right corner. The AGN wind bicone was added as shaded solid purple lines in the background plot, and the sampled region size is indicated at the lower-left corner. All the other symbols and markers of the background plot are the same as Fig. 1.
Current usage metrics show cumulative count of Article Views (full-text article views including HTML views, PDF and ePub downloads, according to the available data) and Abstracts Views on Vision4Press platform.
Data correspond to usage on the plateform after 2015. The current usage metrics is available 48-96 hours after online publication and is updated daily on week days.
Initial download of the metrics may take a while.