Fig. 4.
Download original image
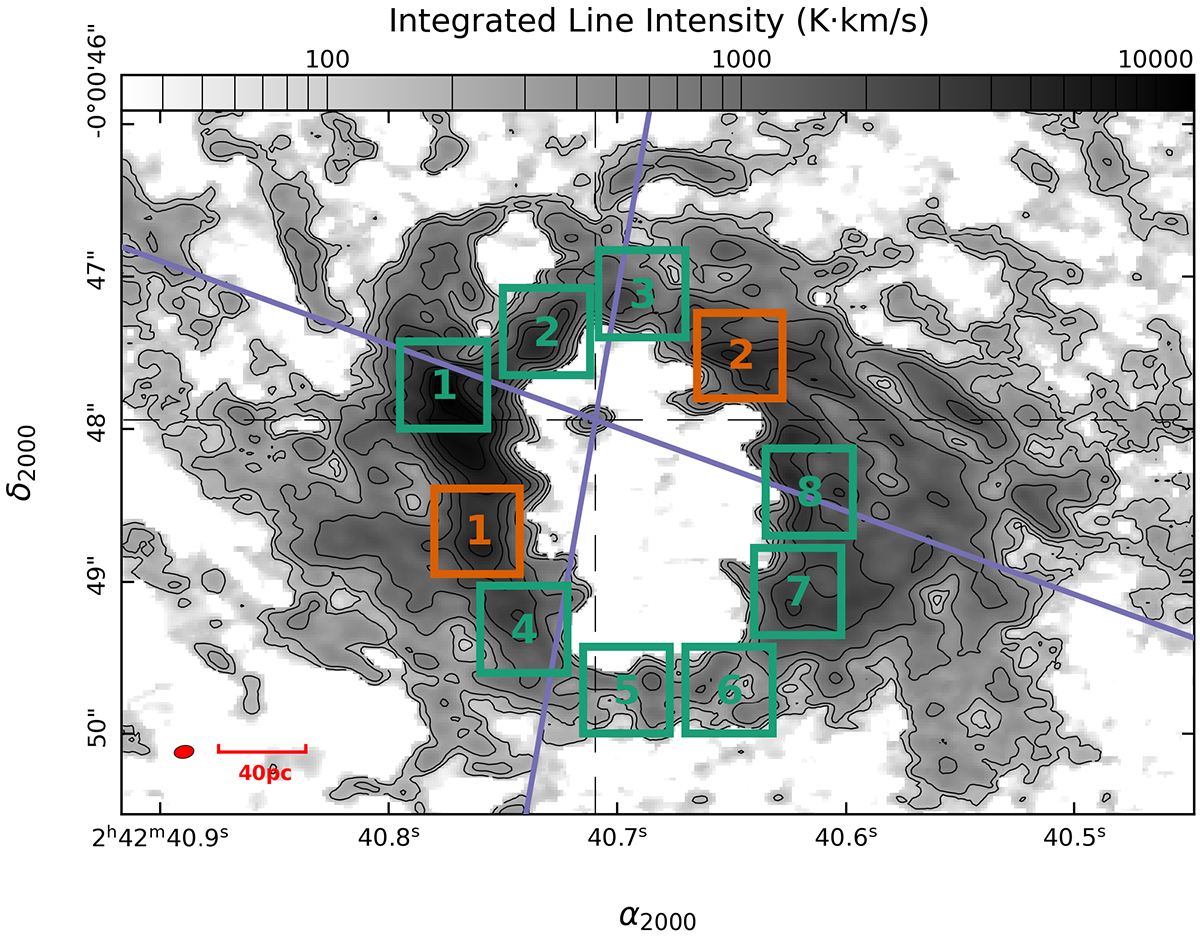
Region selection based on the AGN wind bicone indicated by the purple lines. The green regions are located either within the bicone or along the edge of the bicone, while the orange regions are outside the bicone. The numbers marked within each region match those in region codes displayed in Table 2 and are defined in Sect. 3.2. The background plot, including markers and symbols, is the de-colored CO(2–1) velocity-integrated map from Fig. 1.
Current usage metrics show cumulative count of Article Views (full-text article views including HTML views, PDF and ePub downloads, according to the available data) and Abstracts Views on Vision4Press platform.
Data correspond to usage on the plateform after 2015. The current usage metrics is available 48-96 hours after online publication and is updated daily on week days.
Initial download of the metrics may take a while.