Fig. 3.
Download original image
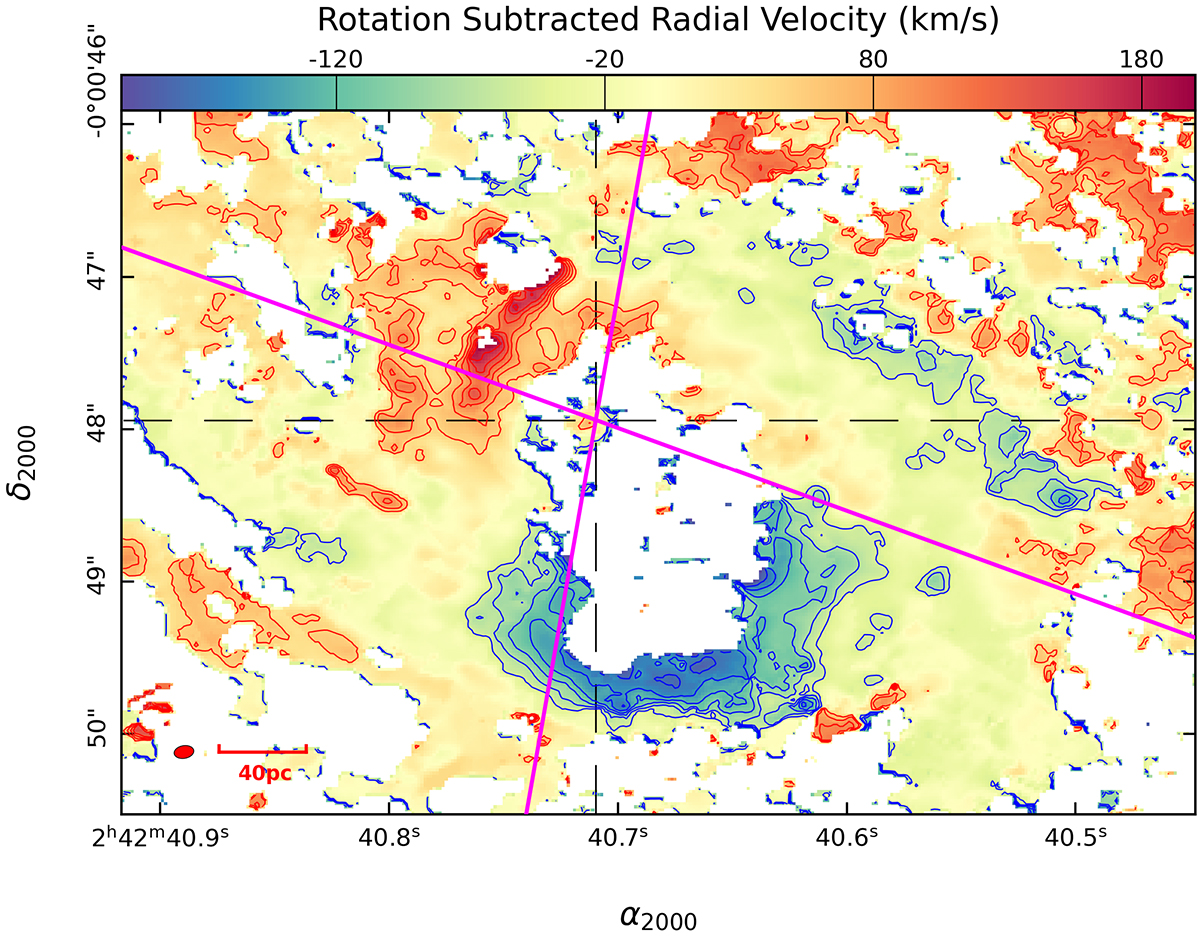
CO(2–1) residual mean velocity field of the CND after the subtraction of projected CND rotation curve produced by García-Burillo et al. (2019). The color scale is within the range [−200, 200] km s−1 relative to the mean motion of the galaxy, vsys = 1120 km s−1, which is set to 0 km s−1. Blue (red) contours span from −200 (+50) to −50 (+200) km s−1 with a spacing of 25 km s−1 relative to vsys. The symbols and markers are the same as in Fig. 2.
Current usage metrics show cumulative count of Article Views (full-text article views including HTML views, PDF and ePub downloads, according to the available data) and Abstracts Views on Vision4Press platform.
Data correspond to usage on the plateform after 2015. The current usage metrics is available 48-96 hours after online publication and is updated daily on week days.
Initial download of the metrics may take a while.