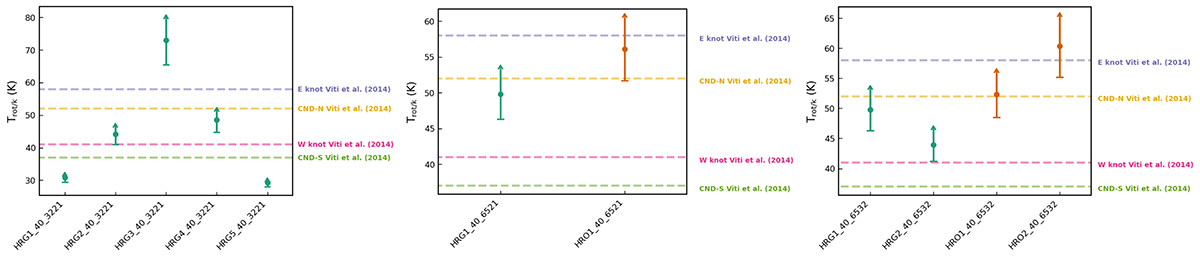
Fig. B.5.
Download original image
Summary of rotational temperatures for all regions sampled around the CND defined based on the CO(3-2)/CO(2-1) (left panel), CO(6-5)/CO(2-1) (middle panel), and CO(6-5)/CO(3-2) (right panel) line ratio. For each panel, the x-axis marks the region labels, while the y-axis indicates the rotational temperatures in the unit of K. The region code (along the x-axis) and color (the color of the data points) of each region match those in Table B.1. All other symbols and markers are the same as in Fig. 7.
Current usage metrics show cumulative count of Article Views (full-text article views including HTML views, PDF and ePub downloads, according to the available data) and Abstracts Views on Vision4Press platform.
Data correspond to usage on the plateform after 2015. The current usage metrics is available 48-96 hours after online publication and is updated daily on week days.
Initial download of the metrics may take a while.