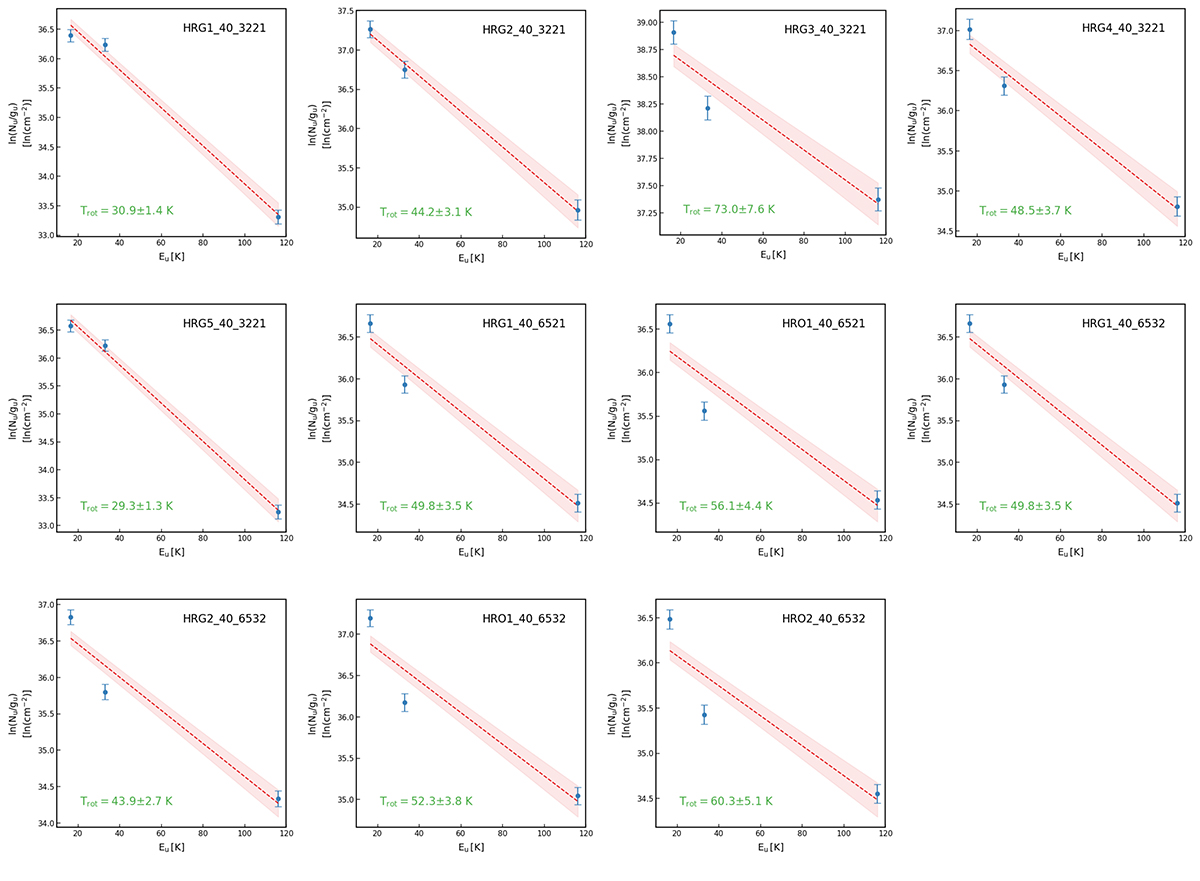
Fig. B.3.
Download original image
Rotational diagrams of regions defined based on line ratios. Region numbers are indicated at the upper right corner of each diagram. The rotational temperature values and their uncertainties are displayed in the lower-left corner of each diagram. All other symbols and markers of each rotational diagram are the same as inset plots in Fig. 5, except that the linear fit and its uncertainty are in red instead of purple.
Current usage metrics show cumulative count of Article Views (full-text article views including HTML views, PDF and ePub downloads, according to the available data) and Abstracts Views on Vision4Press platform.
Data correspond to usage on the plateform after 2015. The current usage metrics is available 48-96 hours after online publication and is updated daily on week days.
Initial download of the metrics may take a while.