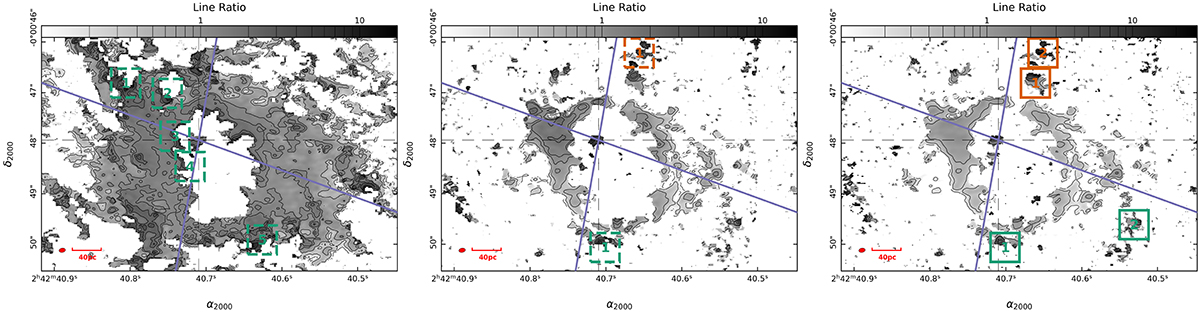
Fig. B.2.
Download original image
Region selection based on the AGN wind bicone, which is indicated by the purple lines, and excitation levels from the line ratio maps. The left, middle, and right panels are the region selections based on the CO(3-2)/CO(2-1), CO(6-5)/CO(2-1), and CO(6-5)/CO(3-2) ratio maps respectively. The number and color of each region correspond to those in the equivalent region code displayed in Table B.1. The dashed regions contain line ratios ≥3σ, while the solid regions only include line ratios ≥2σ. Other schematics of the region definitions are the same as Fig. 4. The underlying plots for all three panels are the corresponding line ratio maps from Fig. B.1.
Current usage metrics show cumulative count of Article Views (full-text article views including HTML views, PDF and ePub downloads, according to the available data) and Abstracts Views on Vision4Press platform.
Data correspond to usage on the plateform after 2015. The current usage metrics is available 48-96 hours after online publication and is updated daily on week days.
Initial download of the metrics may take a while.